


Today we're releasing the 1.0 version of our gem, containing a light-weight AppSignal agent that brings lots of new features to AppSignal (now and in the future).
For the past months we've been hard at work on this new version of our gem. It gathers many more detailed metrics about your app, while running with even less overhead than before.
Right after your Ruby processes finish a request, they send the monitoring data to a light-weight agent running on your system. The agent in turn sends the data our way. Data is no longer stored by a Ruby background thread, so there's no data loss when Ruby crashes and there's the least amount of possible overhead on your processes. In a nutshell: while it has served us well, we're moving away from monitoring Ruby with Ruby.
This 1.0 release also marks the switch to Semantic Versioning for subsequent releases. The whole 1.0 series will be backwards compatible and we will bump the minor version whenever we introduce new features or deprecations.
Once you install the gem, four new features will automatically appear in AppSignal:
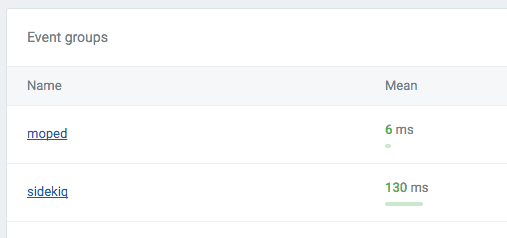
Slow Events
Slow Events helps you keep track of the throughput and performance of individual queries, API calls, and more. See exactly which internal or external services are influencing the performance of your application. By fixing the biggest offenders first, you'll see performance improve across your app.
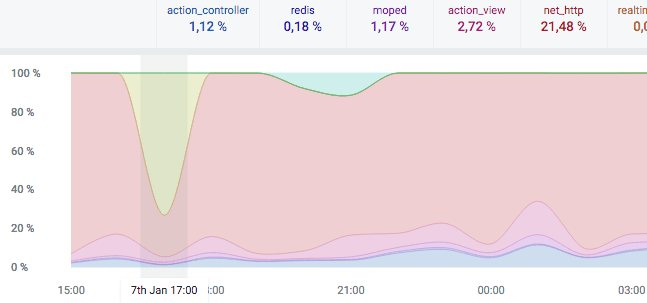
Stacked Graphs
Easily spot trends in what your application is spending time on. When your application slows down, you'll see what the underlying cause is straight away. We provide graphs for both relative values (demonstrated below) and absolute ones, so you can see how events compare and when overall spikes appear.
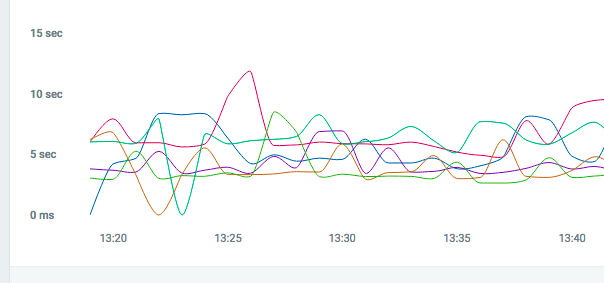
Custom Metrics
Send metrics on anything you want to analyze our way, and create dashboards to make AppSignal plot graphs for them. It's a simple —yet powerful— way to get insights into what's relevant to your infrastructure or business.
We'll cover some use cases for Custom Metrics in a future article, but you can already find lots of information in the AppSignal documentation to get started. And if you have questions, our engineers are only an email away.
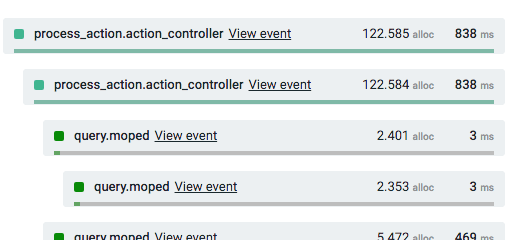
Object Allocation Counts
We all know it can be hard to trace Ruby code that uses lots of memory. With the new Allocation Counts feature you can drill down to the exact spot where you're generating all those pesky objects the Garbage Collector has to clean up later.
In addition to these new features, the revamped agent allows us to bring you more powerful features that we couldn't build based on data from the "old" gem. If you can upgrade (see below), this is an excellent time to do so!
To update to the new version just run bundle update; no configuration changes are needed. At the moment we support Linux and Mac OS. Support for jRuby is on its way (send us an email if you want to be part of the beta).
More information on the gem and its new features is available in our documentation. In the coming period we will publish in-depth articles about the new features and how to use them to keep improving your apps.


