


At AppSignal we use AppSignal to monitor itself. Recently, we noticed a problem with lag on a MongoDB replica set and used Custom Metrics and Anomaly Detection to track the lag and set up alerts on spikes. We track a lot of such metrics to continuously monitor our own infrastructure.
This may sound silly, but recently we got really happy again about this setup. We decided not to be too modest about it this time because it was such a great example of our custom metrics and alerts and we got really excited about it. We hope you enjoy the explanation and we will then slip back into being modest again ;-)
How we use MongoDB
To present AppSignal users with relevant data for performance incidents and/or exceptions, we store data related to requests in what we call samples. A sample describes one request or background job that happened in an application.
These samples are stored in MongoDB replica sets that consist of 1 primary and 2 secondary machines. The replica set makes sure we have redundant copies of our data and additional servers to perform read-only queries.
Lag
Recently, we noticed that at times one of the secondaries couldn’t keep up with the primary machine. Even though, in theory, all machines have the same specs, sometimes you find that a machine performs worse for a number of reasons, like noisy neighbors, for instance.
-> We are aware that there are dedicated MongoDB monitoring products and even one included in MongoDB itself, but a major goal for us was to have all the relevant data for our entire stack in our own app in order to centralize all dashboards and alerts. Having the ability to quickly create a custom dashboard with related MongoDB and application metrics during an outage proved extremely valuable.
Track All the Things
With our Operations team's motto being “Track all the things”, we wanted to graph the replica set lag for all machines in all the clusters, in order to set alerts on them, so that we would be notified when issues arose.
MongoDB has a command that displays the state of each machine in a replica set called replSetGetStatus. On the mongo console you can type rs.status() to get output like this:
1logentries2:PRIMARY> rs.status()
2{
3  "set" : "logentries2",
4  "date" : ISODate("2019-02-02T11:37:13.574Z"),
5  "myState" : 1,
6  "term" : NumberLong(-1),
7  "heartbeatIntervalMillis" : NumberLong(2000),
8  "optimes" : {
9    "lastCommittedOpTime" : {
10      "ts" : Timestamp(1549107433, 1461),
11      "t" : NumberLong(-1)
12    },
13    "appliedOpTime" : Timestamp(1549107433, 1484),
14    "durableOpTime" : Timestamp(1549107433, 1462)
15  },
16  "members" : [
17    {
18      "_id" : 0,
19      "name" : "logentries2-mongo1:27017",
20      "health" : 1,
21      "state" : 1,
22      "stateStr" : "PRIMARY",
23      "uptime" : 161339,
24      "optime" : Timestamp(1549107433, 1484),
25      "optimeDate" : ISODate("2019-02-02T11:37:13Z"),
26      "electionTime" : Timestamp(1548947860, 1),
27      "electionDate" : ISODate("2019-01-31T15:17:40Z"),
28      "configVersion" : 4,
29      "self" : true
30    },
31    {
32      "_id" : 1,
33      "name" : "logentries2-mongo2:27017",
34      "health" : 1,
35      "state" : 2,
36      "stateStr" : "SECONDARY",
37      "uptime" : 159235,
38      "optime" : Timestamp(1549107432, 223),
39      "optimeDurable" : Timestamp(1549107432, 223),
40      "optimeDate" : ISODate("2019-02-02T11:37:12Z"),
41      "optimeDurableDate" : ISODate("2019-02-02T11:37:12Z"),
42      "lastHeartbeat" : ISODate("2019-02-02T11:37:12.367Z"),
43      "lastHeartbeatRecv" : ISODate("2019-02-02T11:37:11.693Z"),
44      "pingMs" : NumberLong(0),
45      "syncingTo" : "logentries2-mongo1:27017",
46      "configVersion" : 4
47    },
48    {
49      "_id" : 2,
50      "name" : "logentries2-mongo3:27017",
51      "health" : 1,
52      "state" : 2,
53      "stateStr" : "SECONDARY",
54      "uptime" : 161327,
55      "optime" : Timestamp(1549107433, 709),
56      "optimeDurable" : Timestamp(1549107433, 709),
57      "optimeDate" : ISODate("2019-02-02T11:37:13Z"),
58      "optimeDurableDate" : ISODate("2019-02-02T11:37:13Z"),
59      "lastHeartbeat" : ISODate("2019-02-02T11:37:13.312Z"),
60      "lastHeartbeatRecv" : ISODate("2019-02-02T11:37:12.112Z"),
61      "pingMs" : NumberLong(1),
62      "syncingTo" : "logentries2-mongo1:27017",
63      "configVersion" : 4
64    }
65  ],
66  "ok" : 1
67}
We can use this information to track how much the secondary machines are behind the primary one.
Tracking the Lag in Appsignal
Since we use Mongoid on Ruby, we can ask the Mongoid client for this status. Because we have multiple replica sets, we loop the clients and get the status for each replica set and server.
1class ReplicasetLagMonitor
2  attr_reader :status
3
4  def initialize(client)
5    @status = client
6      .with(:database => "admin", :user => "admin-readonly", :password => ENV["MONGOID_MONITORING_PASSWORD"])
7      .command(:replSetGetStatus => 1)
8      .first
9  end
10
11  def primary
12    status["members"].find{ |member| member["stateStr"] == "PRIMARY" }
13  end
14
15  # Depending on the version of MongoDB it either returns a `BSON::Timestamp` directly
16  # or it returns the `BSON::Timestamp` in a `ts` object.
17  def optime(member)
18    if member["optime"].is_a?(BSON::Timestamp)
19      member["optime"].seconds
20    else
21      member["optime"]["ts"].seconds
22    end
23  end
24
25  def hostname(member)
26    member["name"].split(":").first
27  end
28
29  def monitor(member)
30    lag = (optime(primary) - optime(member)) * 1000 # Convert to milliseconds
31
32    Appsignal.set_gauge(
33      "replicaset_lag",
34      lag,
35      {:replicaset => status["set"], :hostname => hostname(member)}
36    )
37  end
38
39  def monitor_members!
40    status["members"].each do |member|
41      monitor(member)
42    end
43  end
44
45  def self.monitor_all
46    Mongoid.clients.keys.each do |key|
47      begin
48        client = Mongoid.client(key)
49        new(client).monitor_members!
50        client.close
51      rescue => error
52        Appsignal.send_error(error)
53      end
54    end
55  end
56end
The code above sends us the current replica set lag in milliseconds each time we run the script (we run it twice a minute).
With the following Custom Metrics configuration, we can render a graph with the lag of each machine.
1- title: MongoDB
2  graphs:
3    - title: "Replica set Lag"
4      line_label: "%replicaset% - %hostname%"
5      kind: gauge
6      format: duration
7      fields:
8        - replicaset_lag
9      headerType: legacy
10tags:
11        replicaset: "*"
12        hostname: "*"
We set the line_label with two variables that will be populated from the tags. To create a graph for all the machines, we use a wildcard on both the replica set name and hostname.
The configuration will render the following graph:

As you can see, we had a little bit of lag on one of our machines.
Alerts
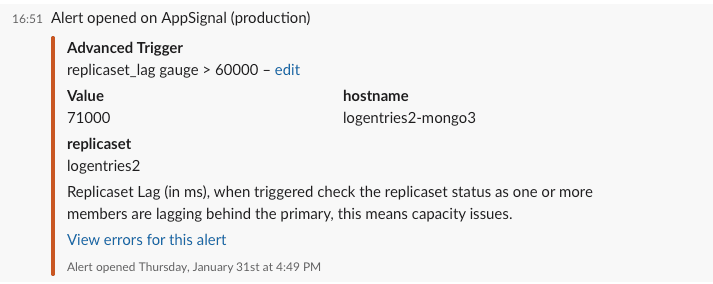
Now that we have the replica set lag in our system, we can use our Anomaly Detection to send us alerts when one of the secondaries starts to lag behind the primary.
In our case, we set two alerts: one that sends a message to a Slack channel and Email when the lag is greater than 5 minutes and another one that triggers PagerDuty when the lag is greater than 10 minutes.
We use the description field to explain why the error was triggered and what actions have to be taken to solve the issue.
Conclusion
We’re very keen on dogfooding our own product. Custom Metrics together with Anomaly Detection give us the means to track and alert on almost everything in our stack, making AppSignal a one-stop shop for both our product and the infrastructure surrounding it.
Set up your own Custom Metrics and Anomaly Detection with the help of our documentation. You can also contact one of our engineers to help you set it up.


