

Elixir provides a very powerful suite of tools that devs can use to observe the behavior of their code and debug errors.
There are several different strategies you can use to debug code in Elixir.
While it is hard to produce a comprehensive list of all possible debugging methods, we will cover some of the most common methods in today's post.
1. The IO Module: puts/2 and inspect/2
Use the IO module for a quick and easy way to get some basic visibility into your code when debugging.
You can print out log statements that:
- tell you where you are in executing code
- inspect structs and other entities
- display the function's arguments
puts/2 and inspect/2 are the most interesting to use when debugging.
With these, it's easy to sprinkle a few good output messages throughout your code and then visualize what's happening.
puts/2 just prints out a string to the intended device (or :stdio if you don't provide anything).
inspect/2 does something similar but writes out formatted output (e.g., pretty-printing maps, structs, and arrays).
There are a couple of options to select the width or a label for the message:
1> IO.inspect(%{foo: :bar}, label: "some map")
2# some map: %{foo: :bar}
The great thing about IO.inspect/2 is that it returns the input, so it is easy to tap into long pipes:
1[1, 2, 3]
2|> IO.inspect(label: "before")
3|> Enum.map(&(&1 * 2))
4|> IO.inspect(label: "after")
5|> Enum.sum
In addition to this, if you need to create strings with embedded maps for the log messages, it is also possible to use Kernel.inspect/2 inside puts strings — like this:
1> IO.puts("some map: #{inspect(%{foo: :bar})}")
2# some map: %{foo: :bar}
The inspect method has a lot more options to customize your output.
Finally, if you need to access a function's arguments quickly, it is possible to use binding/1.
1defmodule Greeter do
2  def greet(name \\ "John Doe") do
3    IO.inspect(binding())
4  end
5end
6
7Greeter.greet() # Prints [name: "John Doe"]
8Greeter.greet("Jane Doe") # Prints [name: "Jane Doe"]
2. IEx for Advanced Debugging Control
If you need advanced control for debugging, the next tool you'll find useful is the interactive shell IEx.
IEx lets you inspect and visualize the current state of your code, manually execute code, and examine the results.
Just pop in require IEx; IEx.pry anywhere in your code and then run it with iex. So, if you are running a:
- Standalone elixir file with
elixir fib.exs, useiex -r fib.exsinstead. - Mix command like
mix run fib.exsormix phx.server, useiex -S mix run fib.exsoriex -S mix phx.server.
Let's take a look at some of the things we can do with IEx.
Using Pry with IEx
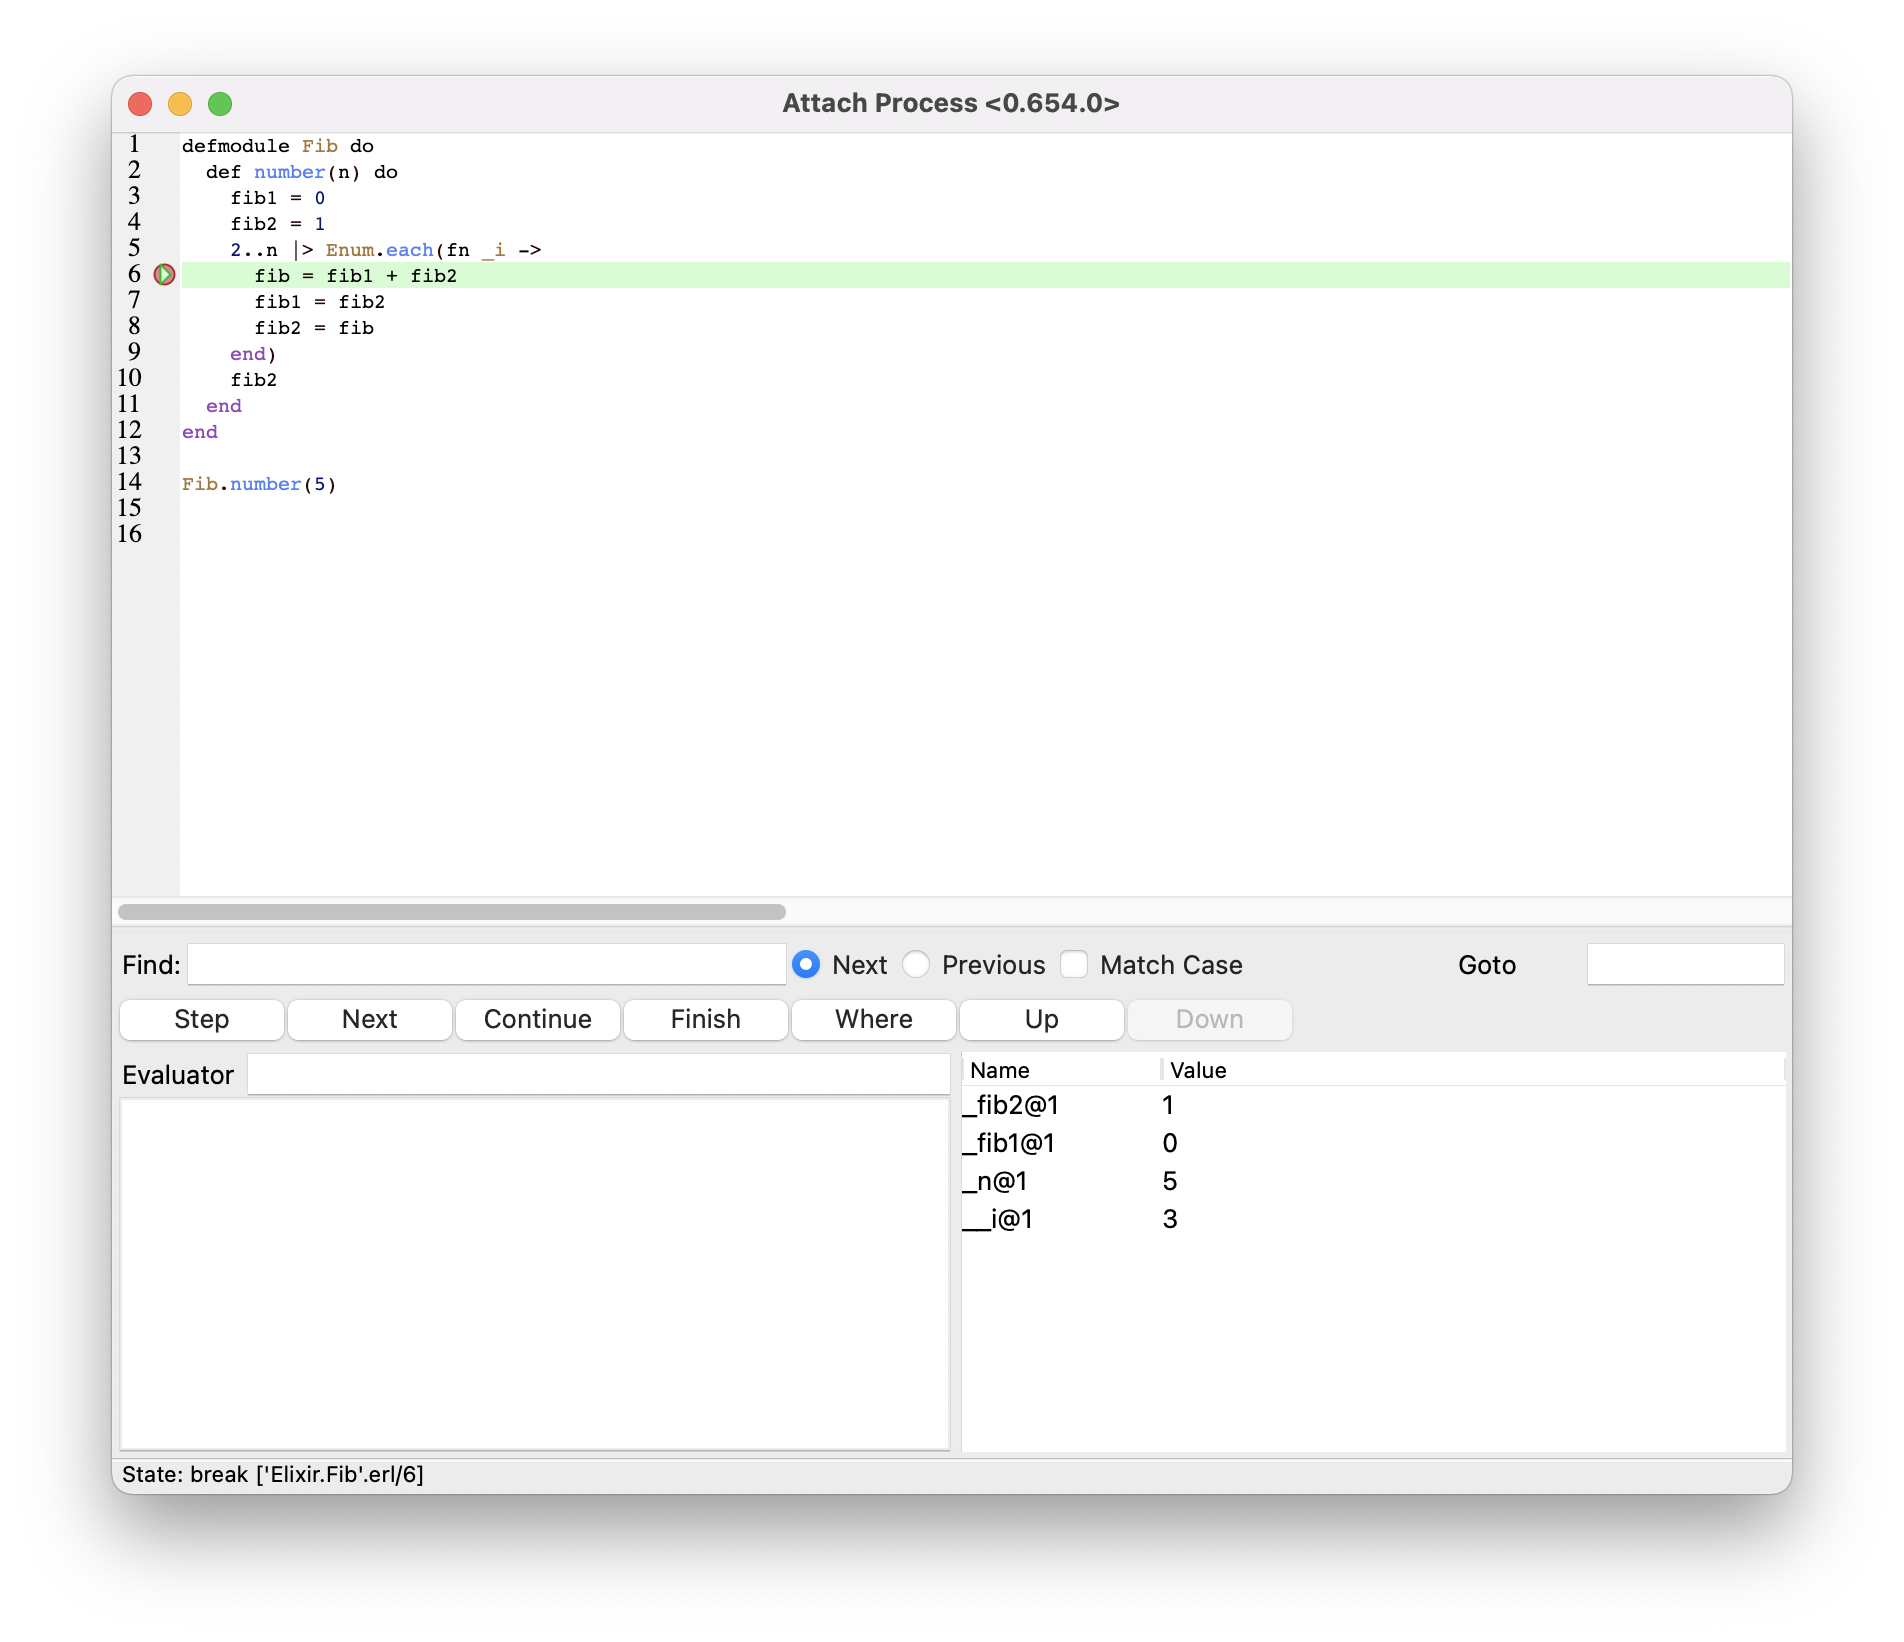
Let's see how debugging works with pry by looking at a buggy Fibonacci number generator. The code does not produce the expected result. Let's put a require IEx; IEx.pry on line 9 (just after fib2 = fib) and run it with iex -r fib.exs:
1Request to pry #PID<0.104.0> at Fib.number/1 (fib.exs:9)
2
3    7:       fib1 = fib2
4    8:       fib2 = fib
5    9:       require IEx; IEx.pry
6   10:     end)
7   11:     fib2
8
9Allow? [Yn] y
10Interactive Elixir (1.12.0) - press Ctrl+C to exit (type h() ENTER for help)
11pry(1)> binding()
12[_i: 2, fib: 1, fib1: 1, fib2: 1, n: 5]
We can see that it stops at the IEx.pry() call. Then, we can inspect the values of the variables (or just use binding to output all context).
For the first iteration, everything looks good, fib2 updates to 1, and fib1 uses the previous value of fib2, i.e., 1.
On the next iteration, we expect fib2 to be 1 + 1 = 2 and fib1 to be 1, and then fib2 to be 2 + 1 = 3 and fib1 to be 2, and so on.
So let's type continue to go to the next pry call and inspect the binding again:
1pry(2)> continue
2Break reached: Fib.number/1 (fib.exs:9)
3
4    7:       fib1 = fib2
5    8:       fib2 = fib
6    9:       require IEx; IEx.pry
7   10:     end)
8   11:     fib2
9
10pry(1)> binding()
11[_i: 3, fib: 1, fib1: 1, fib2: 1, n: 5]
Here, we see that we are on the next iteration (_i is 3), but apparently, the other variables do not change at all.
So this is where our bug lies. Everything is immutable in Elixir, so assigning variables inside the anonymous function creates new variables rather than overriding the ones on the outer scope.
We can now use this insight to fix our code.
If you are curious, see the fixed version of the Fibonacci number generator.
Using Breakpoints with IEx
In the previous section, we had to change the code to enter the pry session.
IEx also provides a break! function to set breakpoints without changing code.
This is very important when you want to set breakpoints in parts of code that you don't own, coming from a library or even from Elixir standard modules.
The only drawback is that this only works on compiled code, and you can only break! at the start of the function, not on any arbitrary line.
To use break! with our Fibonacci example:
1$ elixirc fib.ex # This generates a beam file in your current dir
2$ ls *.beam
3Elixir.Fib.beam
4$ iex            # This will load all beam files in the current directory
5iex> IEx.Helpers.break!(Fib.number/1)
6iex> Fib.number(5)
7Break reached: Fib.number/1 (fib.ex:2)
8
9    1: defmodule Fib do
10    2:   def number(n) do
11    3:     fib1 = 0
12    4:     fib2 = 1
Bonus: IEx Tips and Tricks
While we are on IEx, let us look at some general tips that can help you be more productive with it.
The first, and possibly the most important, is to enable shell history if you use IEx a lot. You can then press ↑ to get your last used commands or use ^ + R to reverse search the history of used commands.
There are two ways you can enable shell history:
Enable each session by starting it with a flag:
1$ iex --erl "-kernel shell_history enabled"Enable all sessions by setting the
ERL_AFLAGSenvironment on your shell. Depending on your terminal configuration, you will need to add the following (or its equivalent) to a startup script (like~/.zshrc/~/.bashrc):1export ERL_AFLAGS="-kernel shell_history enabled"
The second tip, which works on the recent version of Elixir (1.12+), means that you can use multi-line pipes directly in the shell. The pipe automatically gets the last evaluated statement's return value. So you can just copy and paste long pipes from your code directly in the IEx session:
1iex(1)> [1, [2], 3]
2[1, [2], 3]
3iex(2)> |> List.flatten()
4[1, 2, 3]
If you often use modules in IEx, you can create a file called .iex.exs from the directory used to access IEx. Alternatively, you can create a global file inside the home directory (~/.iex/exs), and it will be evaluated every time you open an IEx session.
1# Load another ".iex.exs" file
2import_file("~/.iex.exs")
3
4# Import some module from lib that may not yet have been defined
5import_if_available(MyApp.Mod)
6
7# Import Ecto.Query so that querying is always available in the shell
8import Ecto.Query
Finally, there are some cases when you might be using IEx and you make a typo (like an additional bracket or ") and the command cannot be terminated, for example:
1iex> ["abc"
2...  "
3...  ]
In this case, you cannot use ^ + C or ^ + \ as they would terminate the session, rather than just the command. To terminate the command immediately, start a new line with #iex:break:
1iex> ["abc"
2...  "
3...  ]
4...  #iex:break
5** (TokenMissingError) iex:1: incomplete expression
6>
3. Visual Debugging
In addition to the prying functionality provided by Elixir, there is also a more sophisticated Erlang debugger that you can use.
While it works with a single compiled file like IEx.break!, let's try using a file that is a part of a mix project with iex -S mix this time.
1iex> :debugger.start()
2{:ok, #PID<0.672.0>}
3iex> :int.ni(Fib)
4{:module, Fib}
5iex> :int.break(Fib, 6)
6ok
7iex> Fib.number(5)
The above will open the Erlang debugger and stop at the configured breakpoint. This provides a more traditional debugging approach where you can perform a single step or continue to the next breakpoint, evaluate expressions in the current context, etc.
If you are using Visual Studio Code, the ElixirLS plugin supports in-editor breakpoints. There is also similar support in IntelliJ through the intellij-elixir plugin.
Debugging Elixir Processes
A post on debugging Elixir code wouldn't be complete without also covering how to debug processes. While we can use the debugging methods we've already covered, a couple of other process-specific options are available.
Using Trace to Debug Processes in Elixir
Use :sys.trace/2 when you quickly want to see all the messages exchanged between a process and its state updates.
We can use it to start/stop logging the process states and messages. Let's continue with the Fibonacci computer, but this time, wrapped inside a GenServer:
1iex(3)> {:ok, pid} = GenServer.start_link(Fib, nil)
2{:ok, #PID<0.1023.0>}
3iex(4)> :sys.trace(pid, true)
4:ok
5iex(5)> GenServer.call(pid, {:get, 1})
6*DBG* <0.1023.0> got call {get,1} from <0.1004.0>
7*DBG* <0.1023.0> sent 1 to <0.1004.0>, new state #{0 => 0,1 => 1}
81
9iex(6)> GenServer.call(pid, {:get, 2})
10*DBG* <0.1023.0> got call {get,2} from <0.1004.0>
11*DBG* <0.1023.0> sent nil to <0.1004.0>, new state #{0 => 0,1 => 1}
12nil
13iex(3)> GenServer.cast(pid, {:compute, 10})
14*DBG* <0.1031.0> got cast {compute,10}
15:ok
16*DBG* <0.1031.0> new state #{0 => 0,1 => 1,2 => 1,3 => 2,4 => 3,5 => 5,6 => 8,
17                             7 => 13,8 => 21,9 => 34,10 => 55}
18iex(4)> GenServer.call(pid, {:get, 2})
19*DBG* <0.1031.0> got call {get,2} from <0.1029.0>
20*DBG* <0.1031.0> sent 1 to <0.1029.0>, new state #{0 => 0,1 => 1,2 => 1,
21                                                   3 => 2,4 => 3,5 => 5,
22                                                   6 => 8,7 => 13,8 => 21,
23                                                   9 => 34,10 => 55}
241
Debugging Processes with Observer in Elixir
If you prefer a more visual approach, Erlang provides an :observer that opens a user interface you can use to browse the Supervision Tree or check process states and messages.
To access this, all you need is:
1iex> :observer.start()While a full review of :observer would take up a whole new post, here is a small demo of all that is possible:
Wrap-up
In this post, we've covered three common methods of debugging: using the IO module, IEx, and visual debugging. We've also touched on debugging Elixir processes using trace and observer.
Elixir's powerful debugging tools are what make it such a compelling language choice for developers and businesses.
Until next time, enjoy getting stuck into debugging code and processes in Elixir!
P.S. If you'd like to read Elixir Alchemy posts as soon as they get off the press, subscribe to our Elixir Alchemy newsletter and never miss a single post!
Our guest author Pulkit is a senior full-stack engineer and consultant. In his free time, he writes about his experiences on his blog.