

We often get questions about optimizing or monitoring Sidekiq. Monitoring is kind of our game, but optimizing Sidekiq's performance is a different ball game altogether. In reality, optimizing is complex, but let's start by looking at the seemingly simple answers...
Two Ways of Increasing Speed
To start with, speed can be increased in two ways — by doing larger jobs (which could take up more memory or IO or be more complex), or by adjusting concurrency settings or workers (which will use more CPU and possibly IO). Ouch, reality is already kicking in: speed comes at a cost. If you can spare the additional memory, IO or CPU then this is free, but we think it is important to realize the trade-offs that might need to be made.
Increasing Speed Through Concurrency Settings
Sidekiq handles concurrency by using multiple threads in its process. This way, it can process multiple jobs at once, each thread processing one job at a time. By default, Sidekiq uses 10 threads per process. You can configure it to use more threads, thus increasing concurrency.
Do note that the new concurrency model needs to be supported by your app. For instance, it needs a large enough pool of connections to the database and your host needs to be able to handle the increase in I/O operations. You can check out the Sidekiq documentation on concurrency for more information.
Increasing Speed By Running Multiple Workers
Besides spawning multiple processes, you can also run multiple workers. In this way, you can scale up any CPU-intensive parts, running things in parallel when they would otherwise be in each other’s way on the CPU if they were to run in one process. We've previously written about concurrency in Ruby and the Global Interpreter Lock in this article if you want to catch up on that.
Does It Work or Does It Break? What to Monitor and Our Magic Dashboards
Changing the default parameters can have an impact on your application's performance. Before changing the settings, it's recommended to set up monitoring to see if the changes make a positive impact or if they degrade performance.
Let's start by checking if we're breaking things at the host level. You will want to see how resource intensive your app is on the hardware you are running. If you have the capacity left in memory and CPU, you can increase the concurrency settings to make things a little faster.
Regardless of what APM (Application Performance Monitoring) you use, it probably has a way of tracking host metrics. If you use AppSignal, the dashboards for your hosts are automatically created. To ensure that you get alerted before things really run amok, you can easily set up alerts for CPU usage on specific hosts using Anomaly detection.
Now, let's see if things aren't breaking at the Sidekiq level. Your APM of choice will probably allow you to set up monitoring and alerting for your background jobs in some manual way. On AppSignal, this is very easy: we track this for you in the Sidekiq magic dashboard (which gets generated without any setup needed from your end, when you run a recent version of our gem).
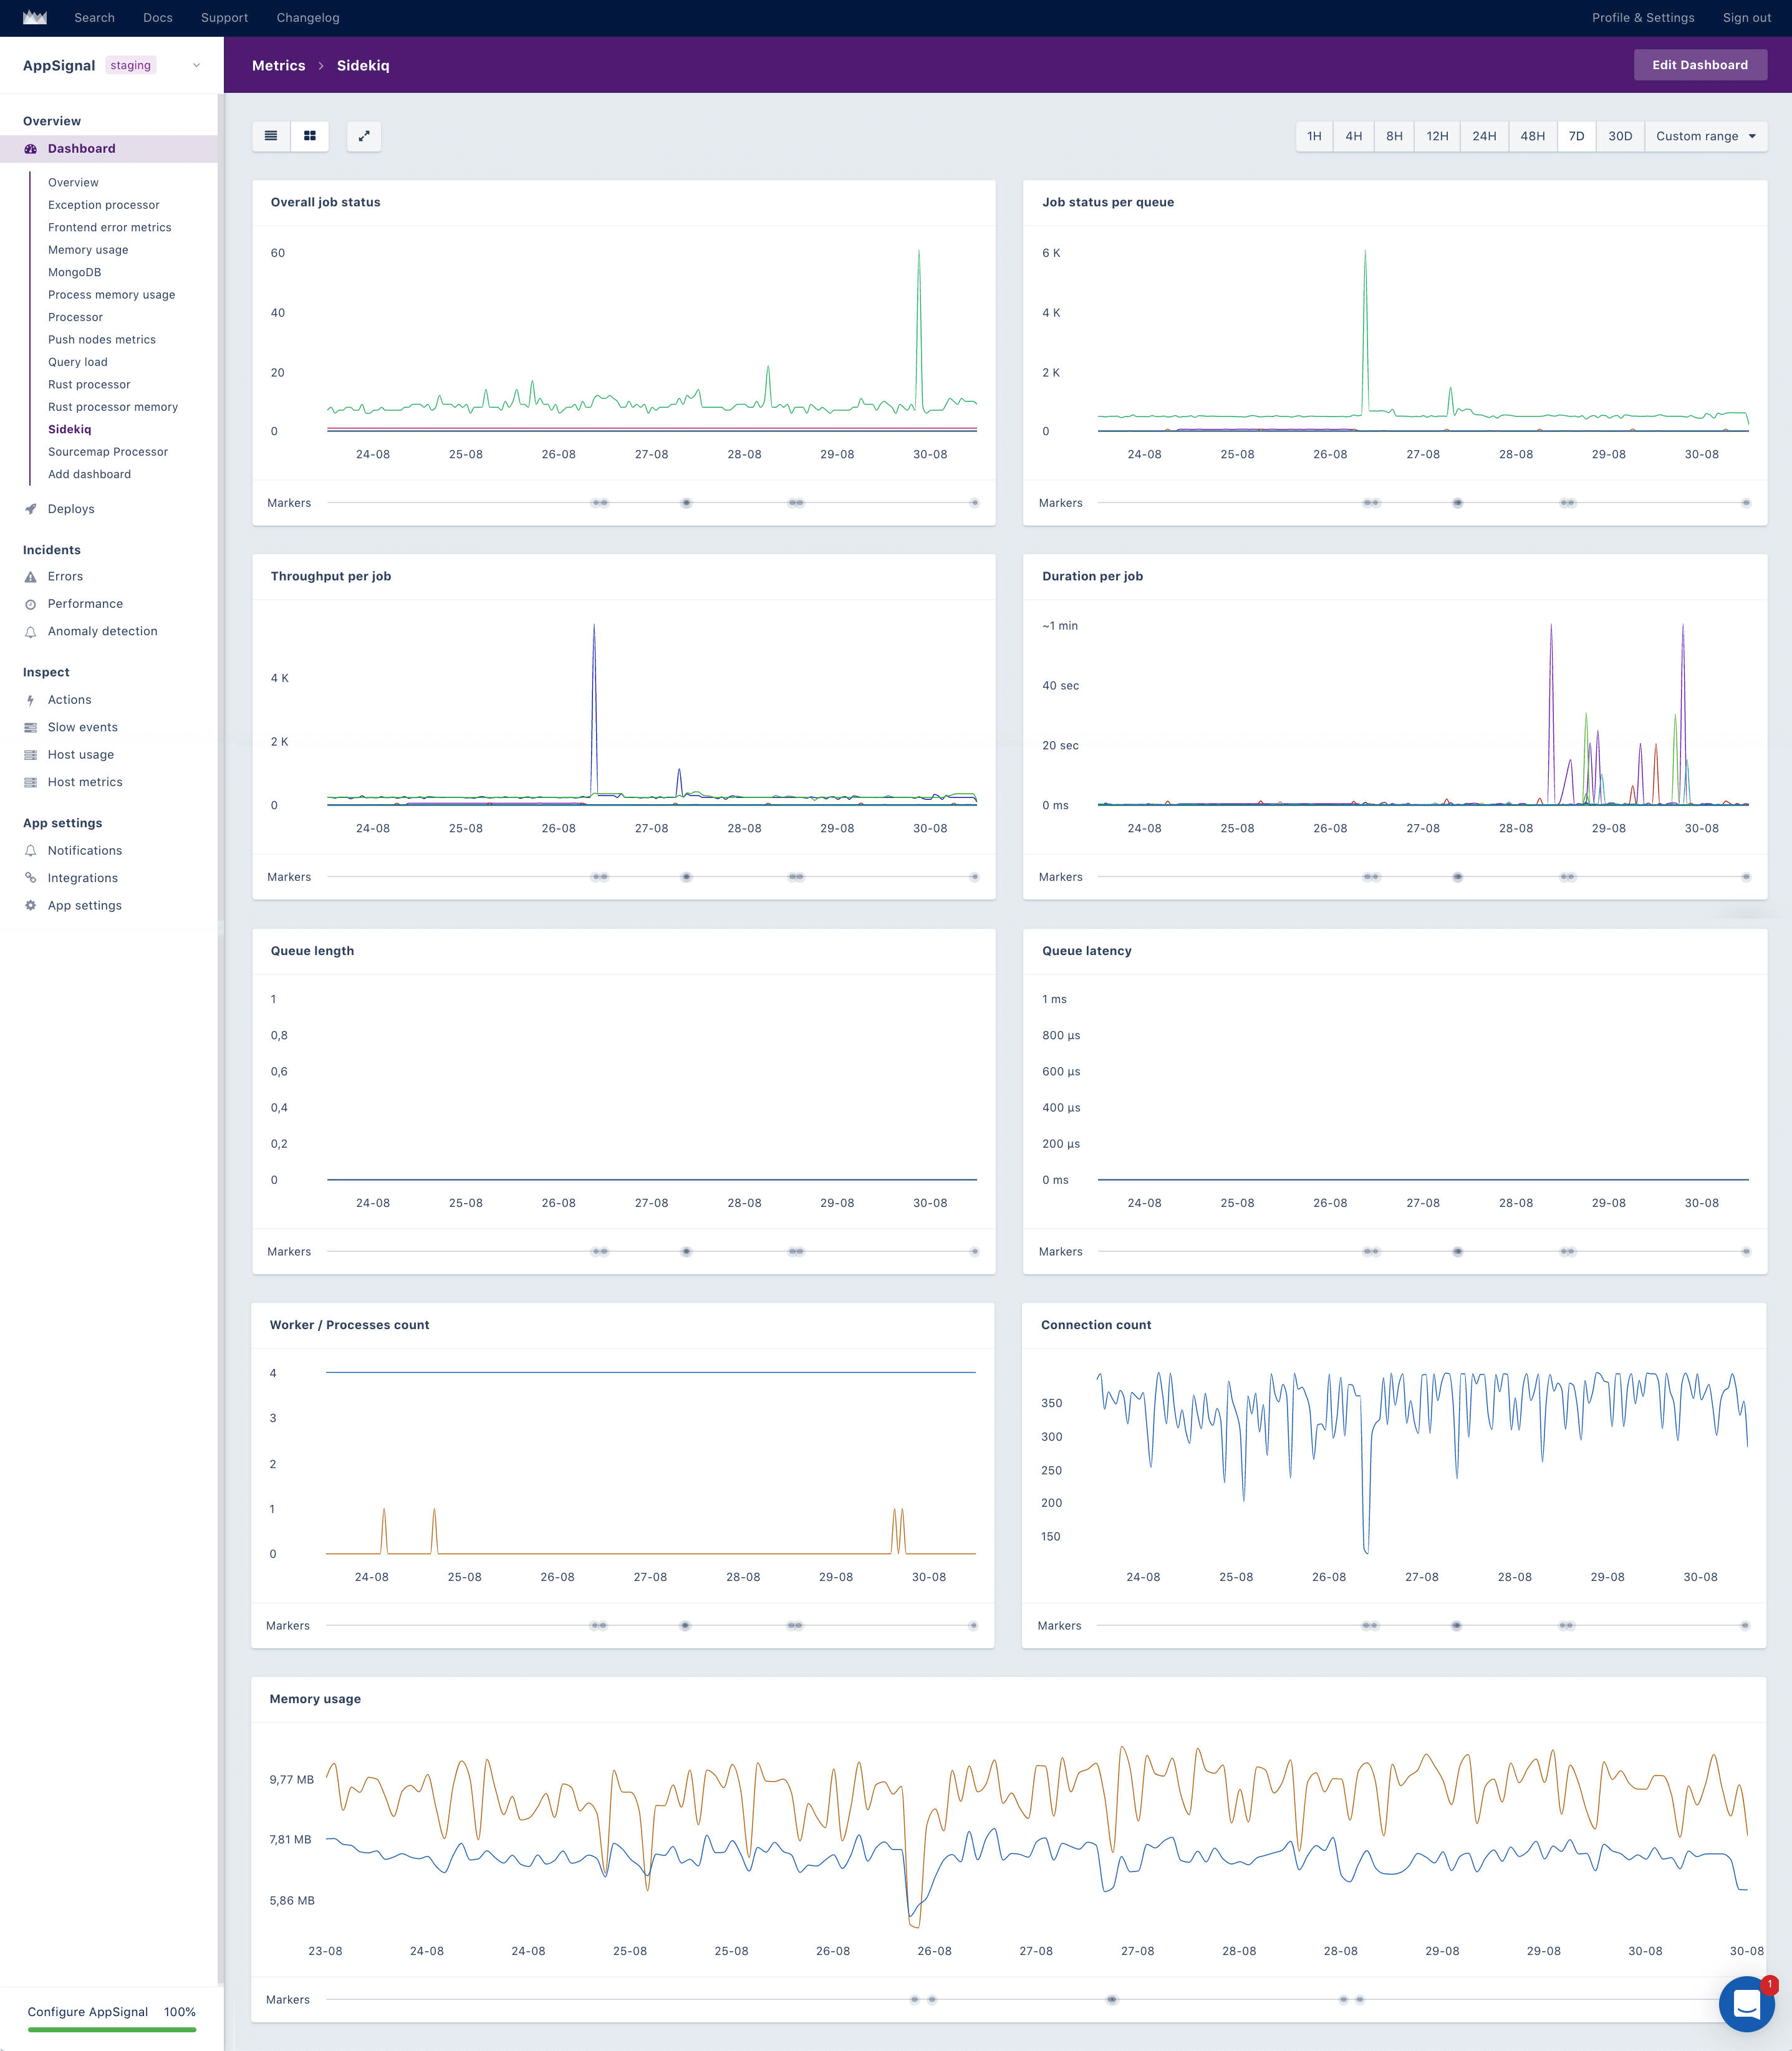
In this setup, you'll want to monitor the job status per queue and set a trigger for the failure rate to be alerted on Slack, PagerDuty, email or whatever you use.
Fewer, Larger Jobs?
We've had a quick look at increasing speed while trading off CPU. Now, let's look at increasing speed while trading off on memory or IO, or more complexity. You would think that you could do that by creating larger jobs. The idea would be that large jobs can be faster because they don't have Sidekiq overhead per operation. In our experience however, the Sidekiq overhead would rarely kill your performance. Often, it is the database queries that the job does that can kill performance. We see that combining more jobs, in order to perform fewer queries is an important way to better performance. Simplified: doing one update of 1000 records rather than 1000 updates of 1 record.
What to Monitor to See Whether This Works or Breaks?
First, you will want to monitor the job status per queue here as well and set a trigger for the failure rate. Since jobs take longer and have more operations, you'll also want to monitor Sidekiq's memory usage. You should also set up an alert on Sidekiq memory use, but specifically, for a host running out of memory using AppSignal's Anomaly detection.
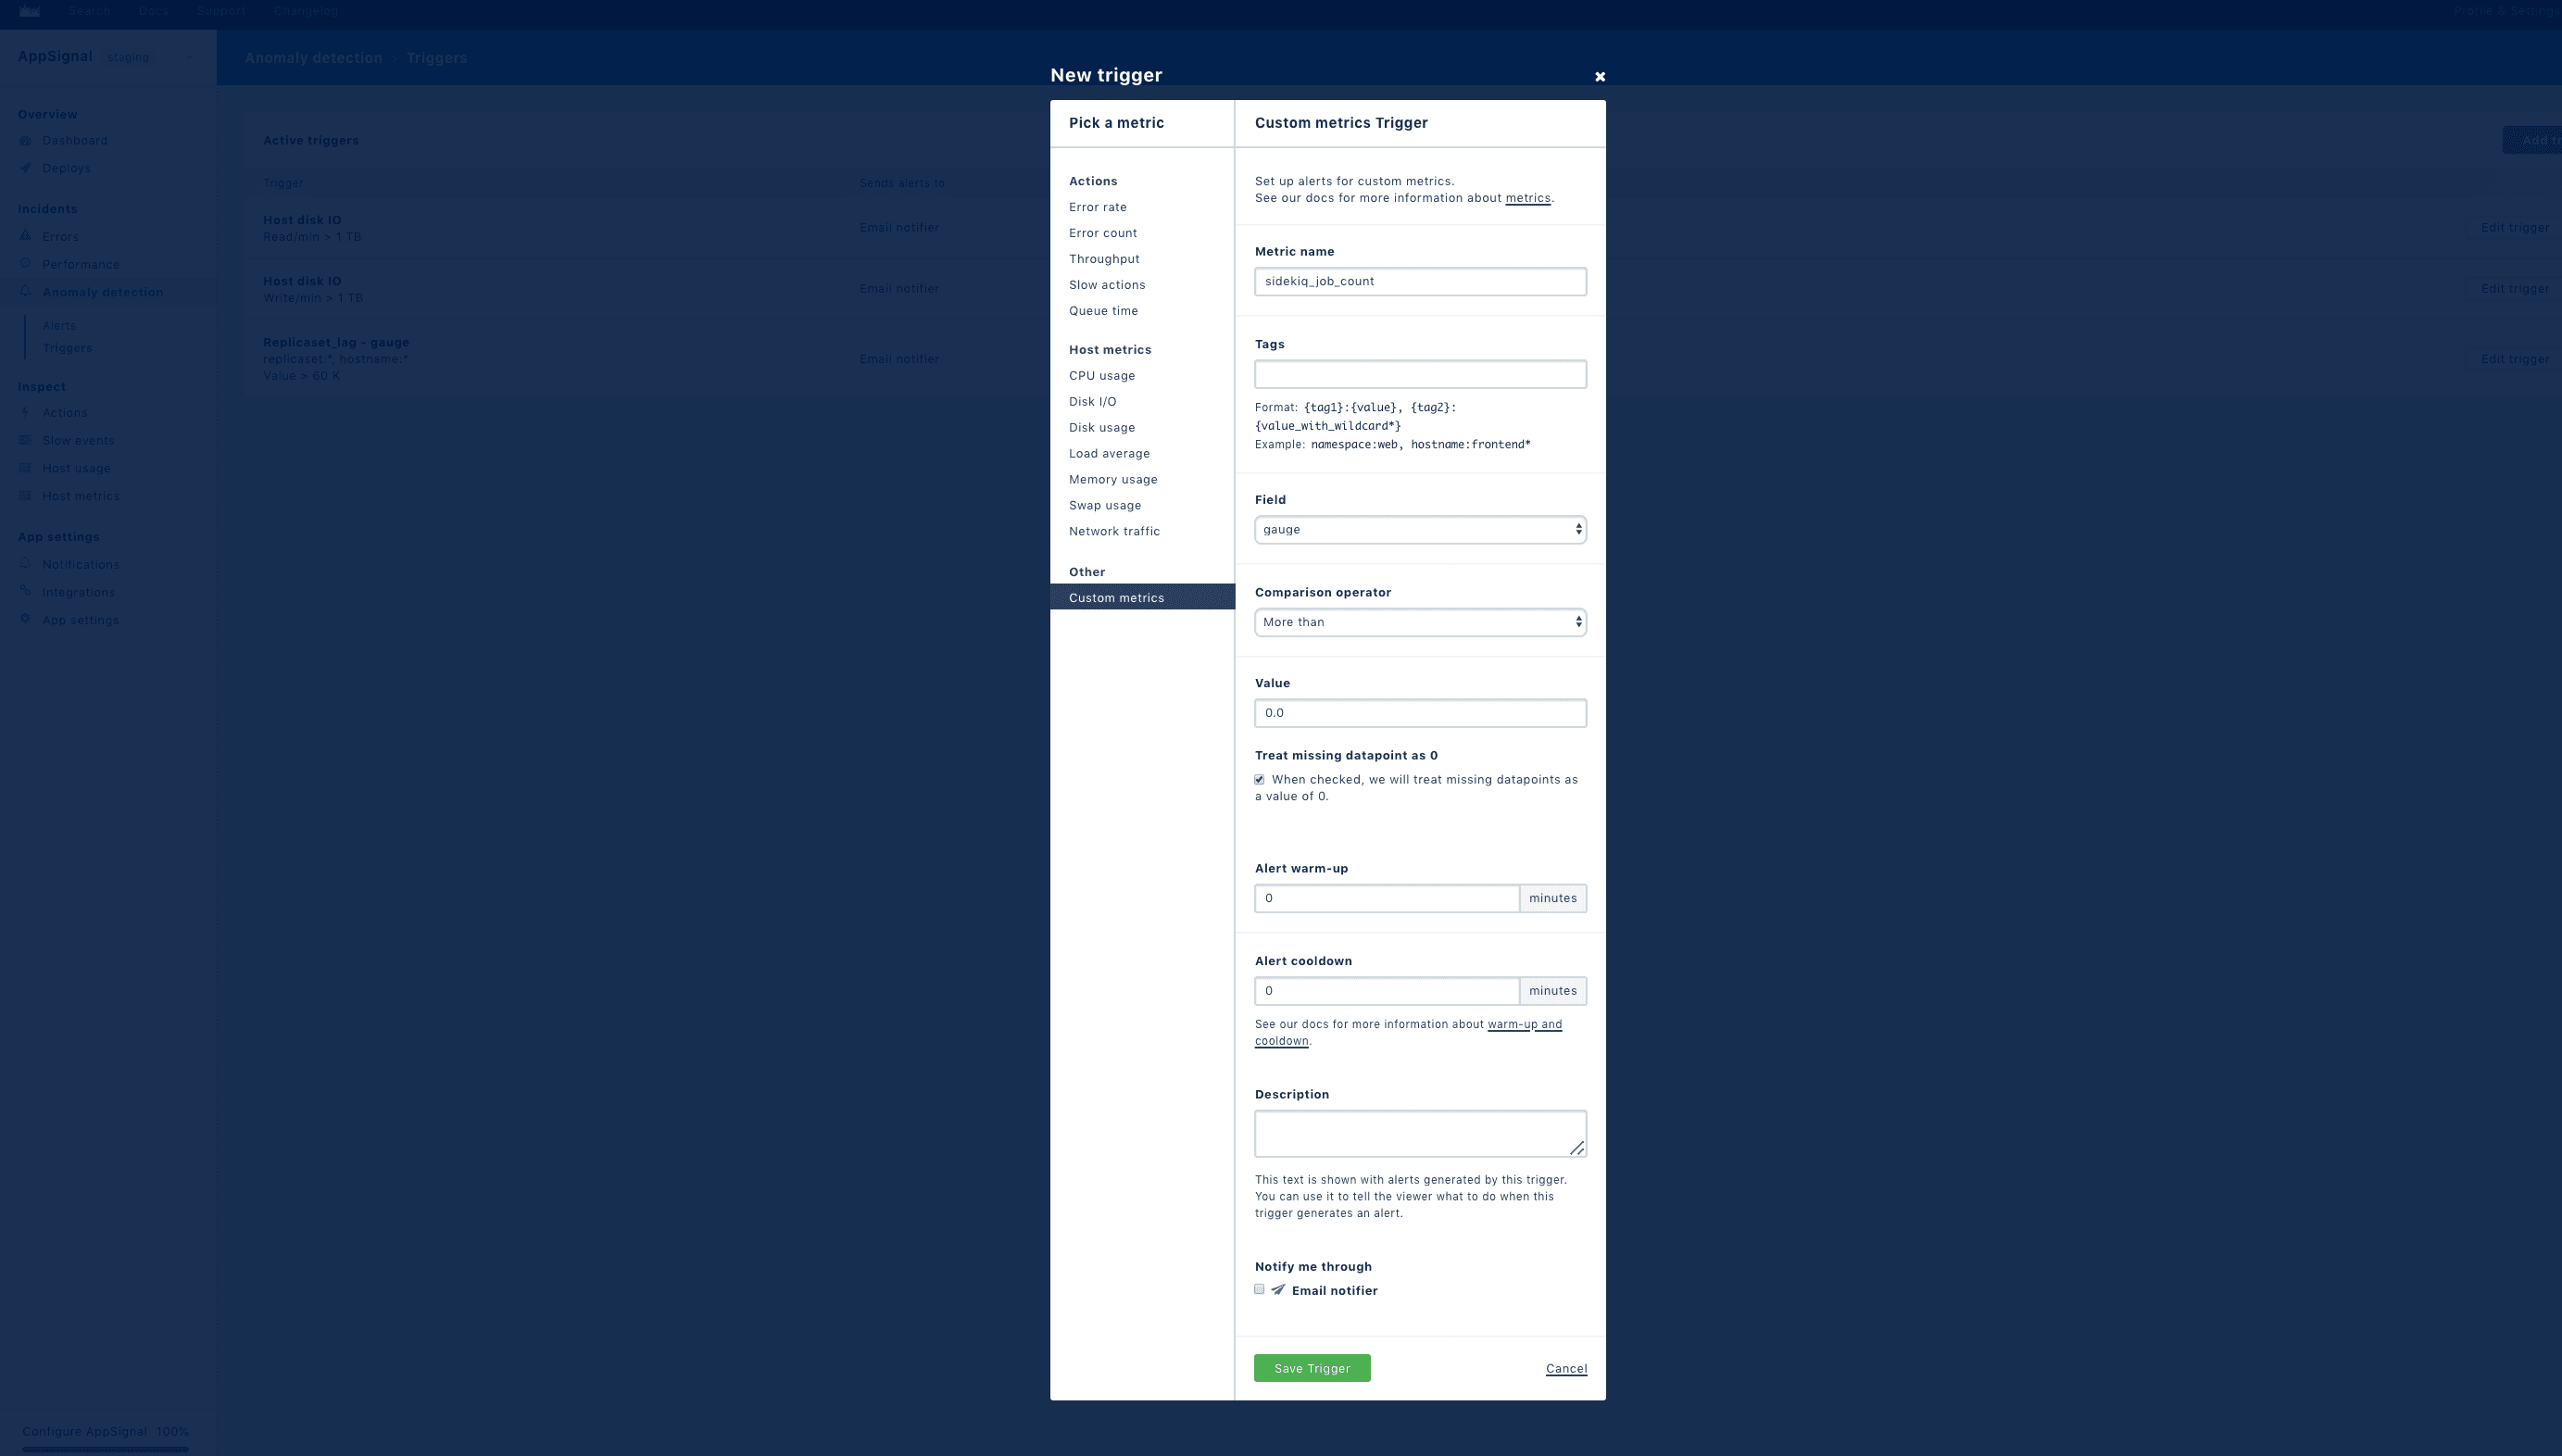
You should also monitor the queue length per queue. This will alert you when there's a backlog forming—when the workers have more queued than they can process. We advise you to set up an Anomaly detection trigger for your 'critical' job queue.
A Trade-Off You Won't See in Your APM
The big problem with larger jobs is that they are harder to code. You’ll have to make the individual jobs explicitly idempotent and keep track of their status. In a simple example: when you have a job that mails one person and it fails, you can retry it without much harm done. When mailing 1000 people, if the job fails, you don’t want to resend to the 240 people you mailed before the job failed. Ensuring that that doesn't happen makes the code more complex.
The Real Complexity of Reality
Time for another reality check. Often, your background processes might not be slow due to anything running in Sidekiq. It might be that the database you are querying is slow because the host it runs on is running out of memory. When looking for a cool example to use in this post, we ran into one such scenario: it turned out the duration was peaking because the external API had a long response time. Nothing in Sidekiq will solve that.
Because a problem can be seen in one place but be caused someplace else entirely, at AppSignal, we've built the product so it has errors, performance, and host metrics all-in-one. The combined metrics of this view will make it easier to find the root cause of the problem.
There Are No Easy Answers, Are There?
Though we started this article with the basics of monitoring and optimizing Sidekiq, we immediately ran into the reality that speed will cost CPU and IO. Or Memory. Or introduce more complexity. And though we touched on some of the complexity of performance in your architecture, the reality is that we skidded around 99% of the hard things in this post.
So, even though we may have taken away your hopes for simple answers, we hope this article provoked some interesting thoughts on optimizing and monitoring your Sidekiq setup!