With our new event type graphs it will be a lot easier to quickly pin-point the cause of a major slowdown of your application.
Before event type graphs, whenever your had a major increase in response times, you had to navigate to individual samples and check the event tree to determine what part of you app caused it.
With the new event type graphs this becomes a lot easier.
How to feed data into the event type graphs
In AppSignal itself we use a ton of instrumentation to get detailed information about each step our background workers perform.
Here's an example of our worker code:
1data = ActiveSupport::Notifications.instrument('decode.protobuf') do
2  PushProtocol::CollectorPayload.decode(protobuf)
3end
We use the ActiveSupport Notifications (Rails) standard of separating the action from the event group with a dot. In the example above the action is decode in the group protobuf. It's the groups of all these instrumentations that end up in our Event graphs.
How do the event type graphs help me debug a performance issue?
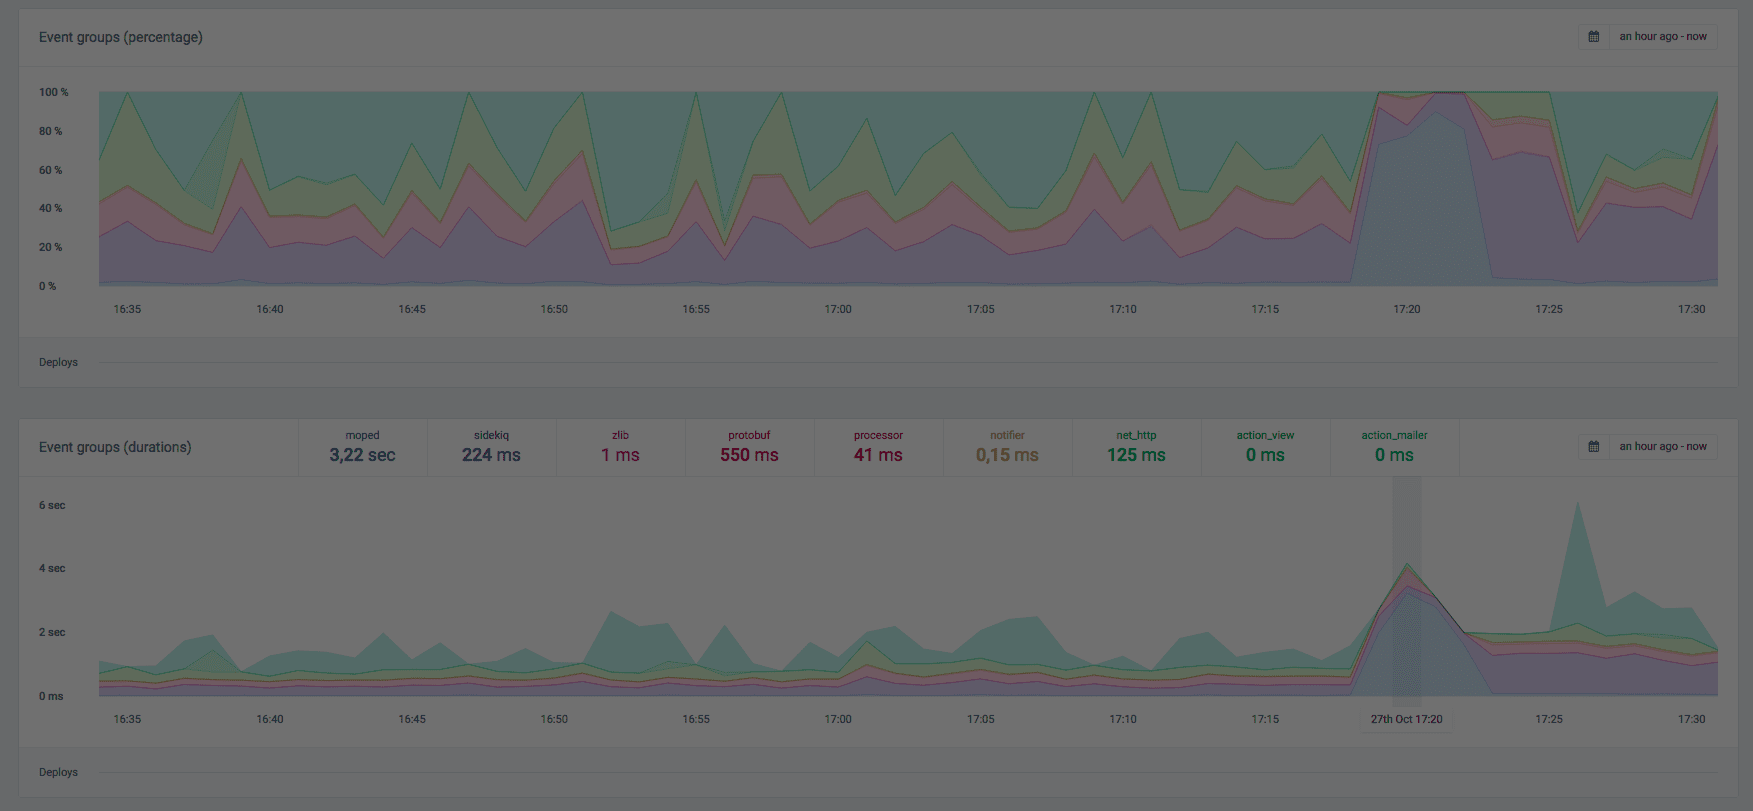
Lets take a real-life example of a major slowdown in our app we experienced a few days ago. Suddenly the duration of our background jobs increased from a few hundred miliseconds to an average of 4 seconds per job.
Without the event type graphs, we'd have to go to individual performance incidents and check the slowest event for each incident to figure out what part of our application is causing the slowdown.
With the graphs we can see in once instance that moped is causing the slowdown, taking up an average of 3.2 seconds per job.
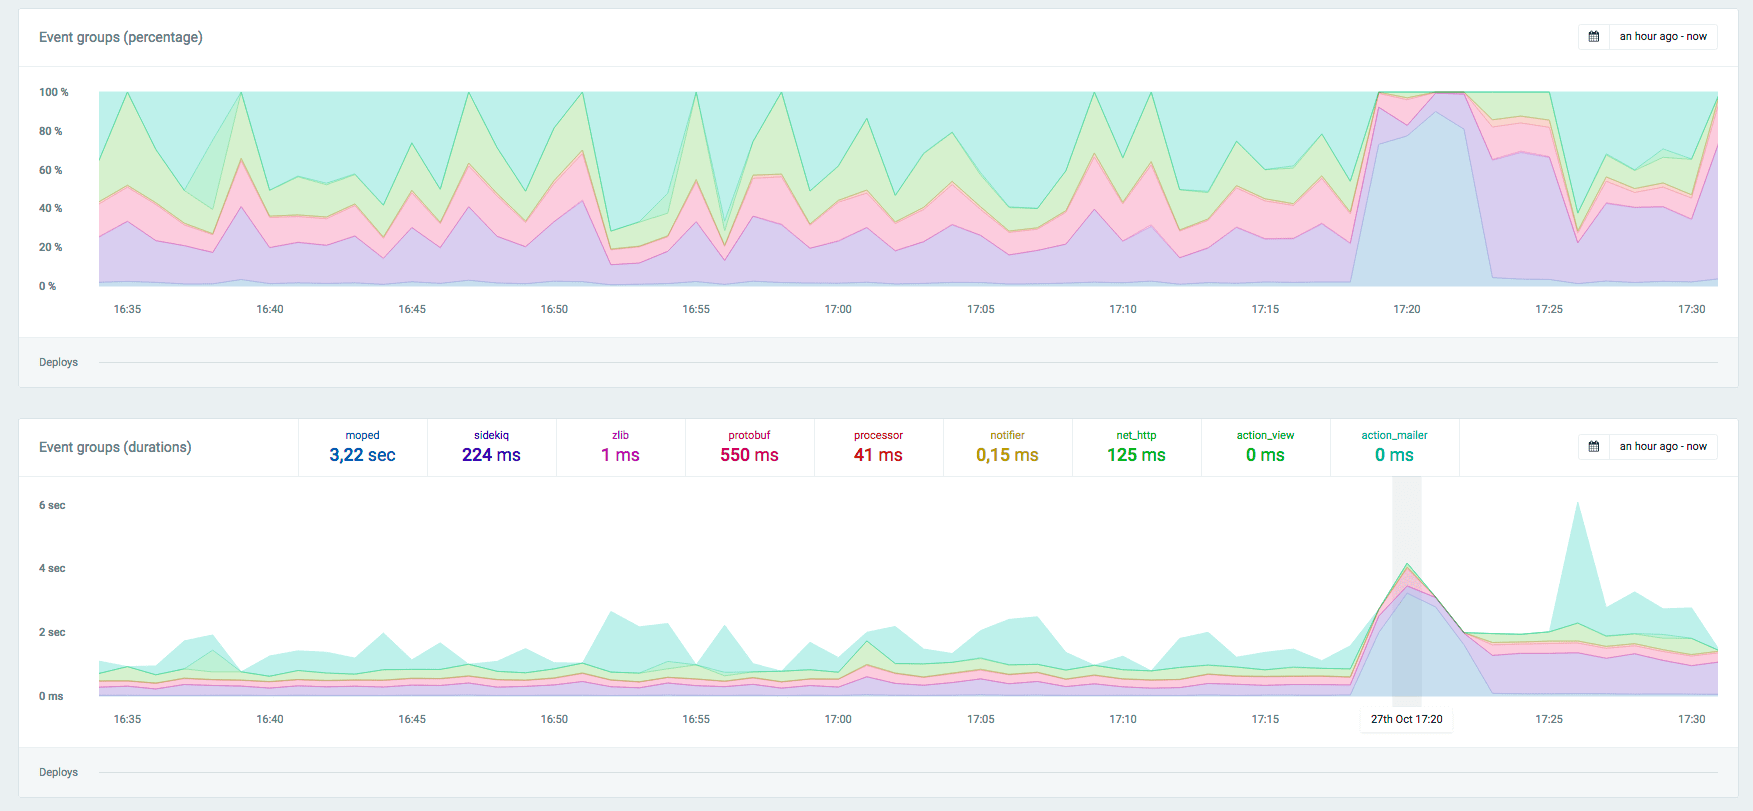
we immediately know that we should check what's happening to our MongoDB cluster.
Why are there two views for the same data?
Event graphs are shown in a relative form and an absolute form.
The absolute form, showing actual durations is useful in case of a major slowdown as you can easily spot what event group is causing issues.
We use the relative graph to spot trends over long timeframes. We can see that our database or our view rendering is taking up more and more time of each individual request, pointing us to possible performance gains we can make.
Do I have to add instrumentation for event type graphs?
By default, Rails will instrument a number of actions, such as:
- action_view
- action_mailer
- active_record
AppSignal will create instrumentation for a number of 3rd party libraries such as:
- net_http
- moped
- sidekiq
- delayed_job
- sequel
- resque
Together these instrumentations cover the bases of any app: view rendering, database queries and application code (controllers/background jobs).
We recommend to instrument anything that might be a performance issue, such as making external requests and running complex operations.
For the best results you should not make too many groups, as graphs become harder to read.
These event type graphs are available for anyone using AppSignal gem 1.0 or above.