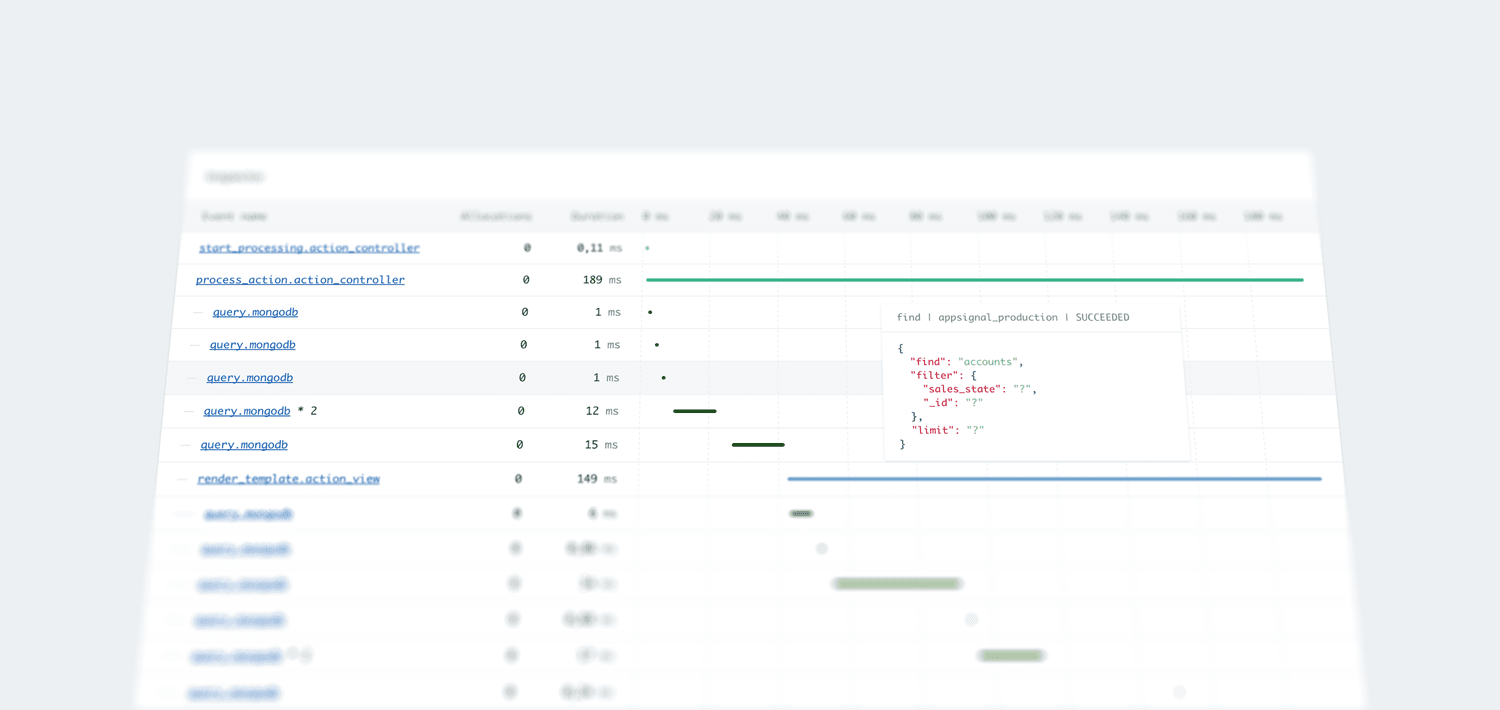
Since our 1.0 agent release, we have continuously shipped great new features. And today, we are very proud to present you a new and improved event timeline. You will find the event time on all your performance sample pages.
The new event timeline is easier to navigate and gives a better overview of everything happening during a request. You can spot slow queries or partials in an instant. Clicking an event gives you detailed information, such as durations over time and the number of times this event has been called.
