
Sometimes standard instrumentation isn't enough to track the root cause of a performance issue. Custom metrics help us track the missing pieces.
Thanks to AppSignal's performance graphs we know exactly what part of our codebase causes performance issues. In the screenshot below you can see we had a severe slowdown because of MongoDB:
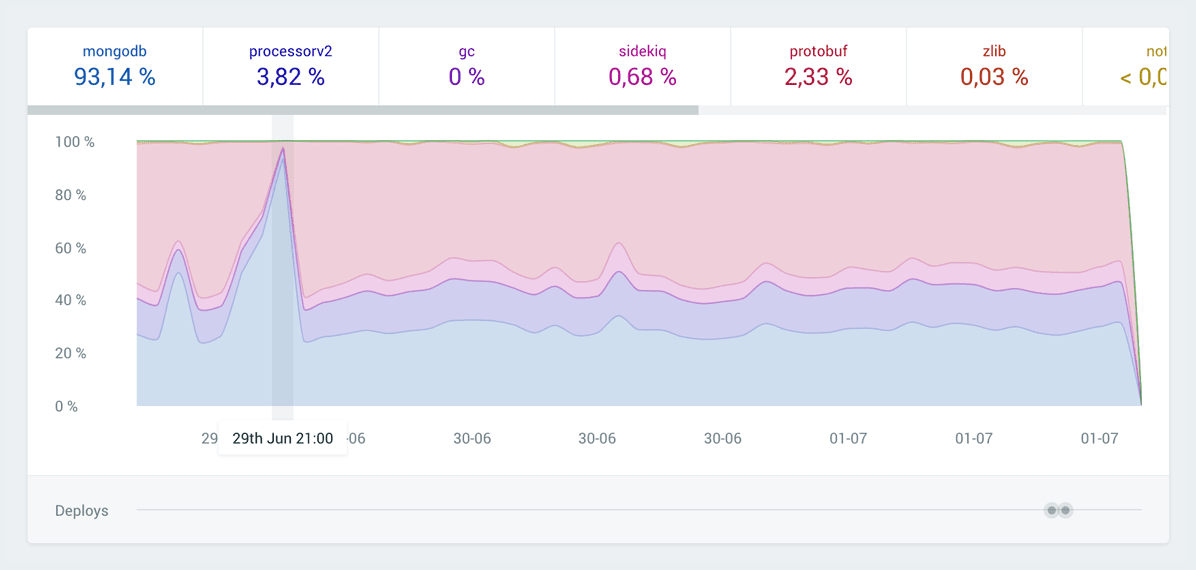
What it doesn't tell us is which of the numerous databases running on different ReplicaSets caused this slowdown. Using our Custom Metrics platform we can answer this question at a glance.
Mongo::Monitoring
With the new 2.x Ruby driver, the mongo gem exposes a monitoring API. We use this to track every query sent to the database.
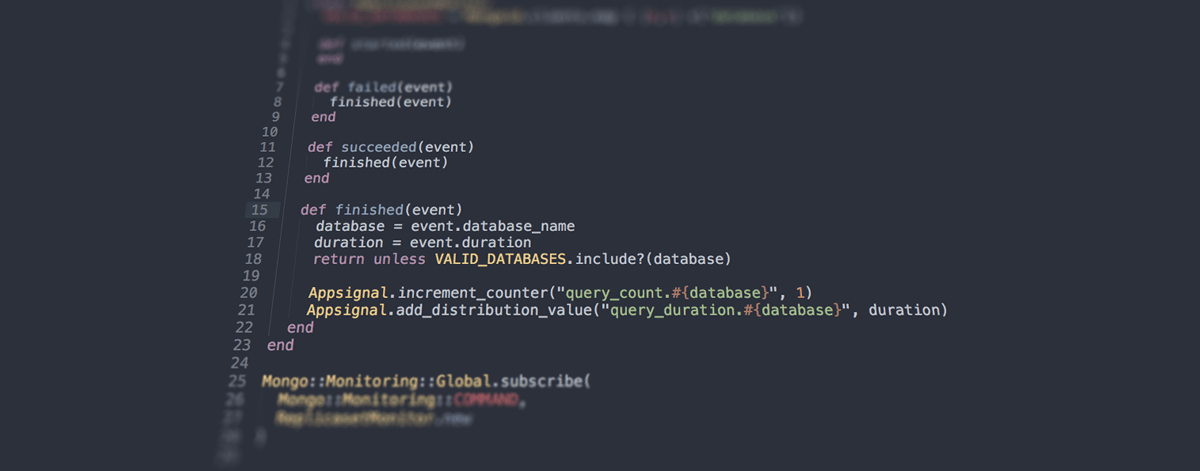
Here's a subscriber class that implements the three required methods (started, succeeded and failed) and sends the data to AppSignal:
1# config/initializers/mongo_command_subscriber.rb
2class MongoComandSubscriber
3  VALID_DATABASES = Mongoid.clients.map { |k,v| v['database']}
4
5  def started(event)
6  end
7
8  def failed(event)
9    finished(event)
10  end
11
12  def succeeded(event)
13    finished(event)
14  end
15
16  def finished(event)
17    database = event.database_name
18    duration = event.duration
19    return unless VALID_DATABASES.include?(database)
20
21    Appsignal.increment_counter("query_count.#{database}", 1)
22    Appsignal.add_distribution_value("query_duration.#{database}", duration)
23  end
24end
25
26# Subscribe to all COMMAND queries with our subscriber class
27Mongo::Monitoring::Global.subscribe(
28  Mongo::Monitoring::COMMAND,
29  MongoComandSubscriber.new
30)
Custom Metrics dashboard
Now that we're sending these metrics to AppSignal, we have to create a dashboard to visualize the metrics. Let's create two graphs, one for the query count and one for the average query duration:
1- title: "MongoDB Query Load"
2  graphs:
3    - title: "Database Query count"
4      kind: count
5      filter: "query_count/*"
6      format: number
7    - title: "Database average query duration"
8      kind: measurement
9      filter: "query_duration/*"
10      format: duration
We use the filter key to provide a Regex that matches any query duration we have sent to AppSignal.
The result
Now we track the individual query count/duration and have a dashboard in place, and can see which of the databases caused the spike in our performance graph:
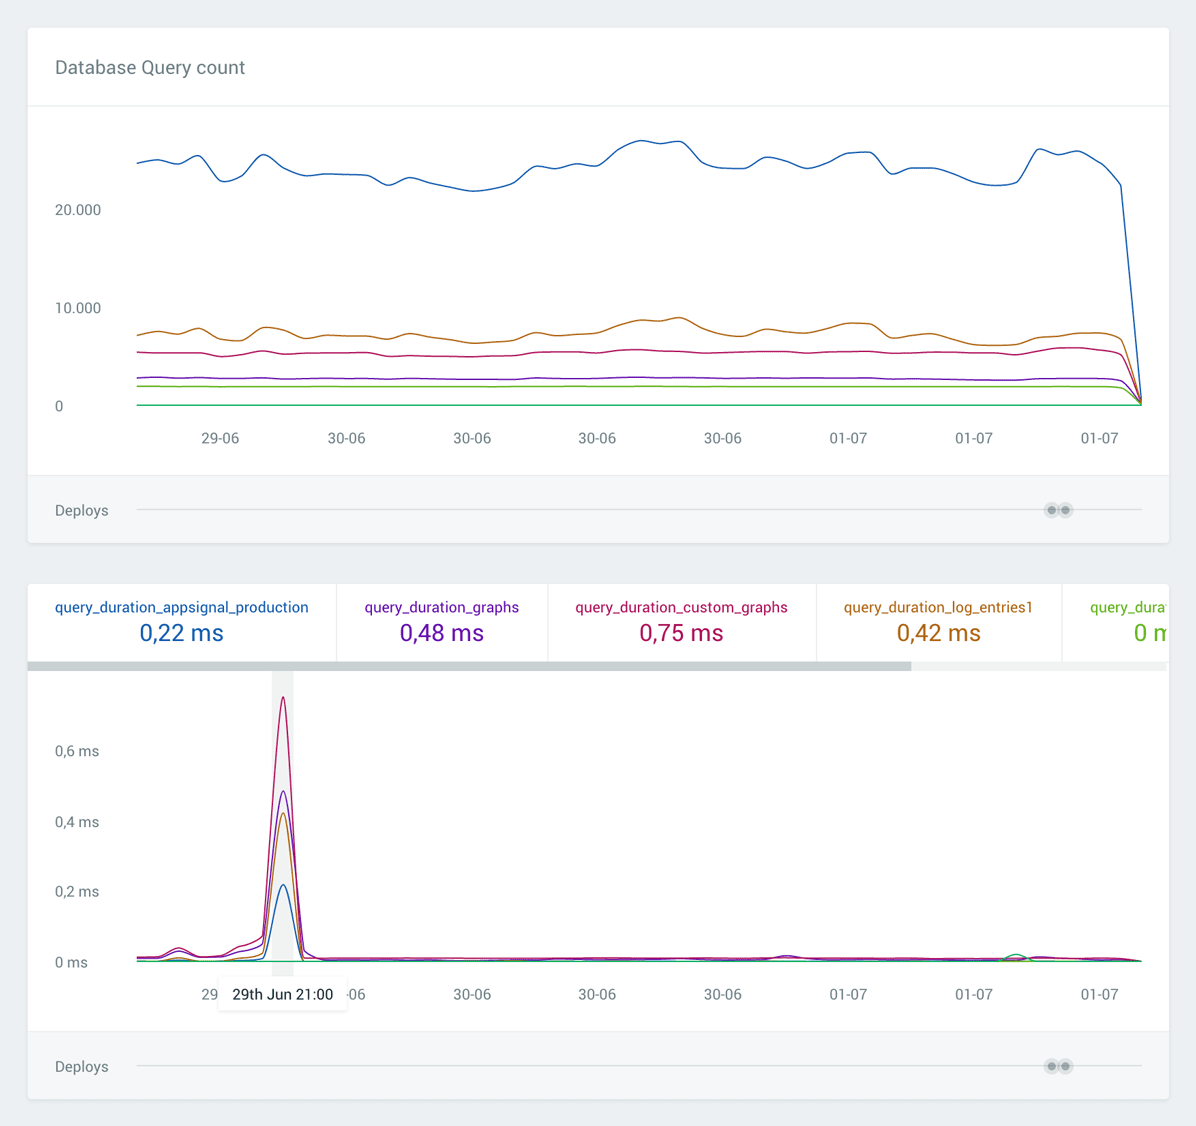
This is one of the many examples where using Custom Metrics helps gaining more insights into the overall performance of our (and your!) application.
If you'd like to give Custom Metrics a try, or need help in identifying and tracking valuable metrics, just let us know.