

Tools like top, uptime, w and AppSignal's host metrics report a metric called load average. This metric tells you about the load your system has been under, averaged over multiple timeframes.
1$ uptime
210:14:14 up 60 days, 17:42,  1 user,  load average: 0.44, 0.28, 0.25
Load averages are usually displayed as three numbers, like in the example from uptime above. The three numbers at the end of the result show the average load in the last minute (0.44), in the last five minutes (0.28), and the last fifteen (0.25).
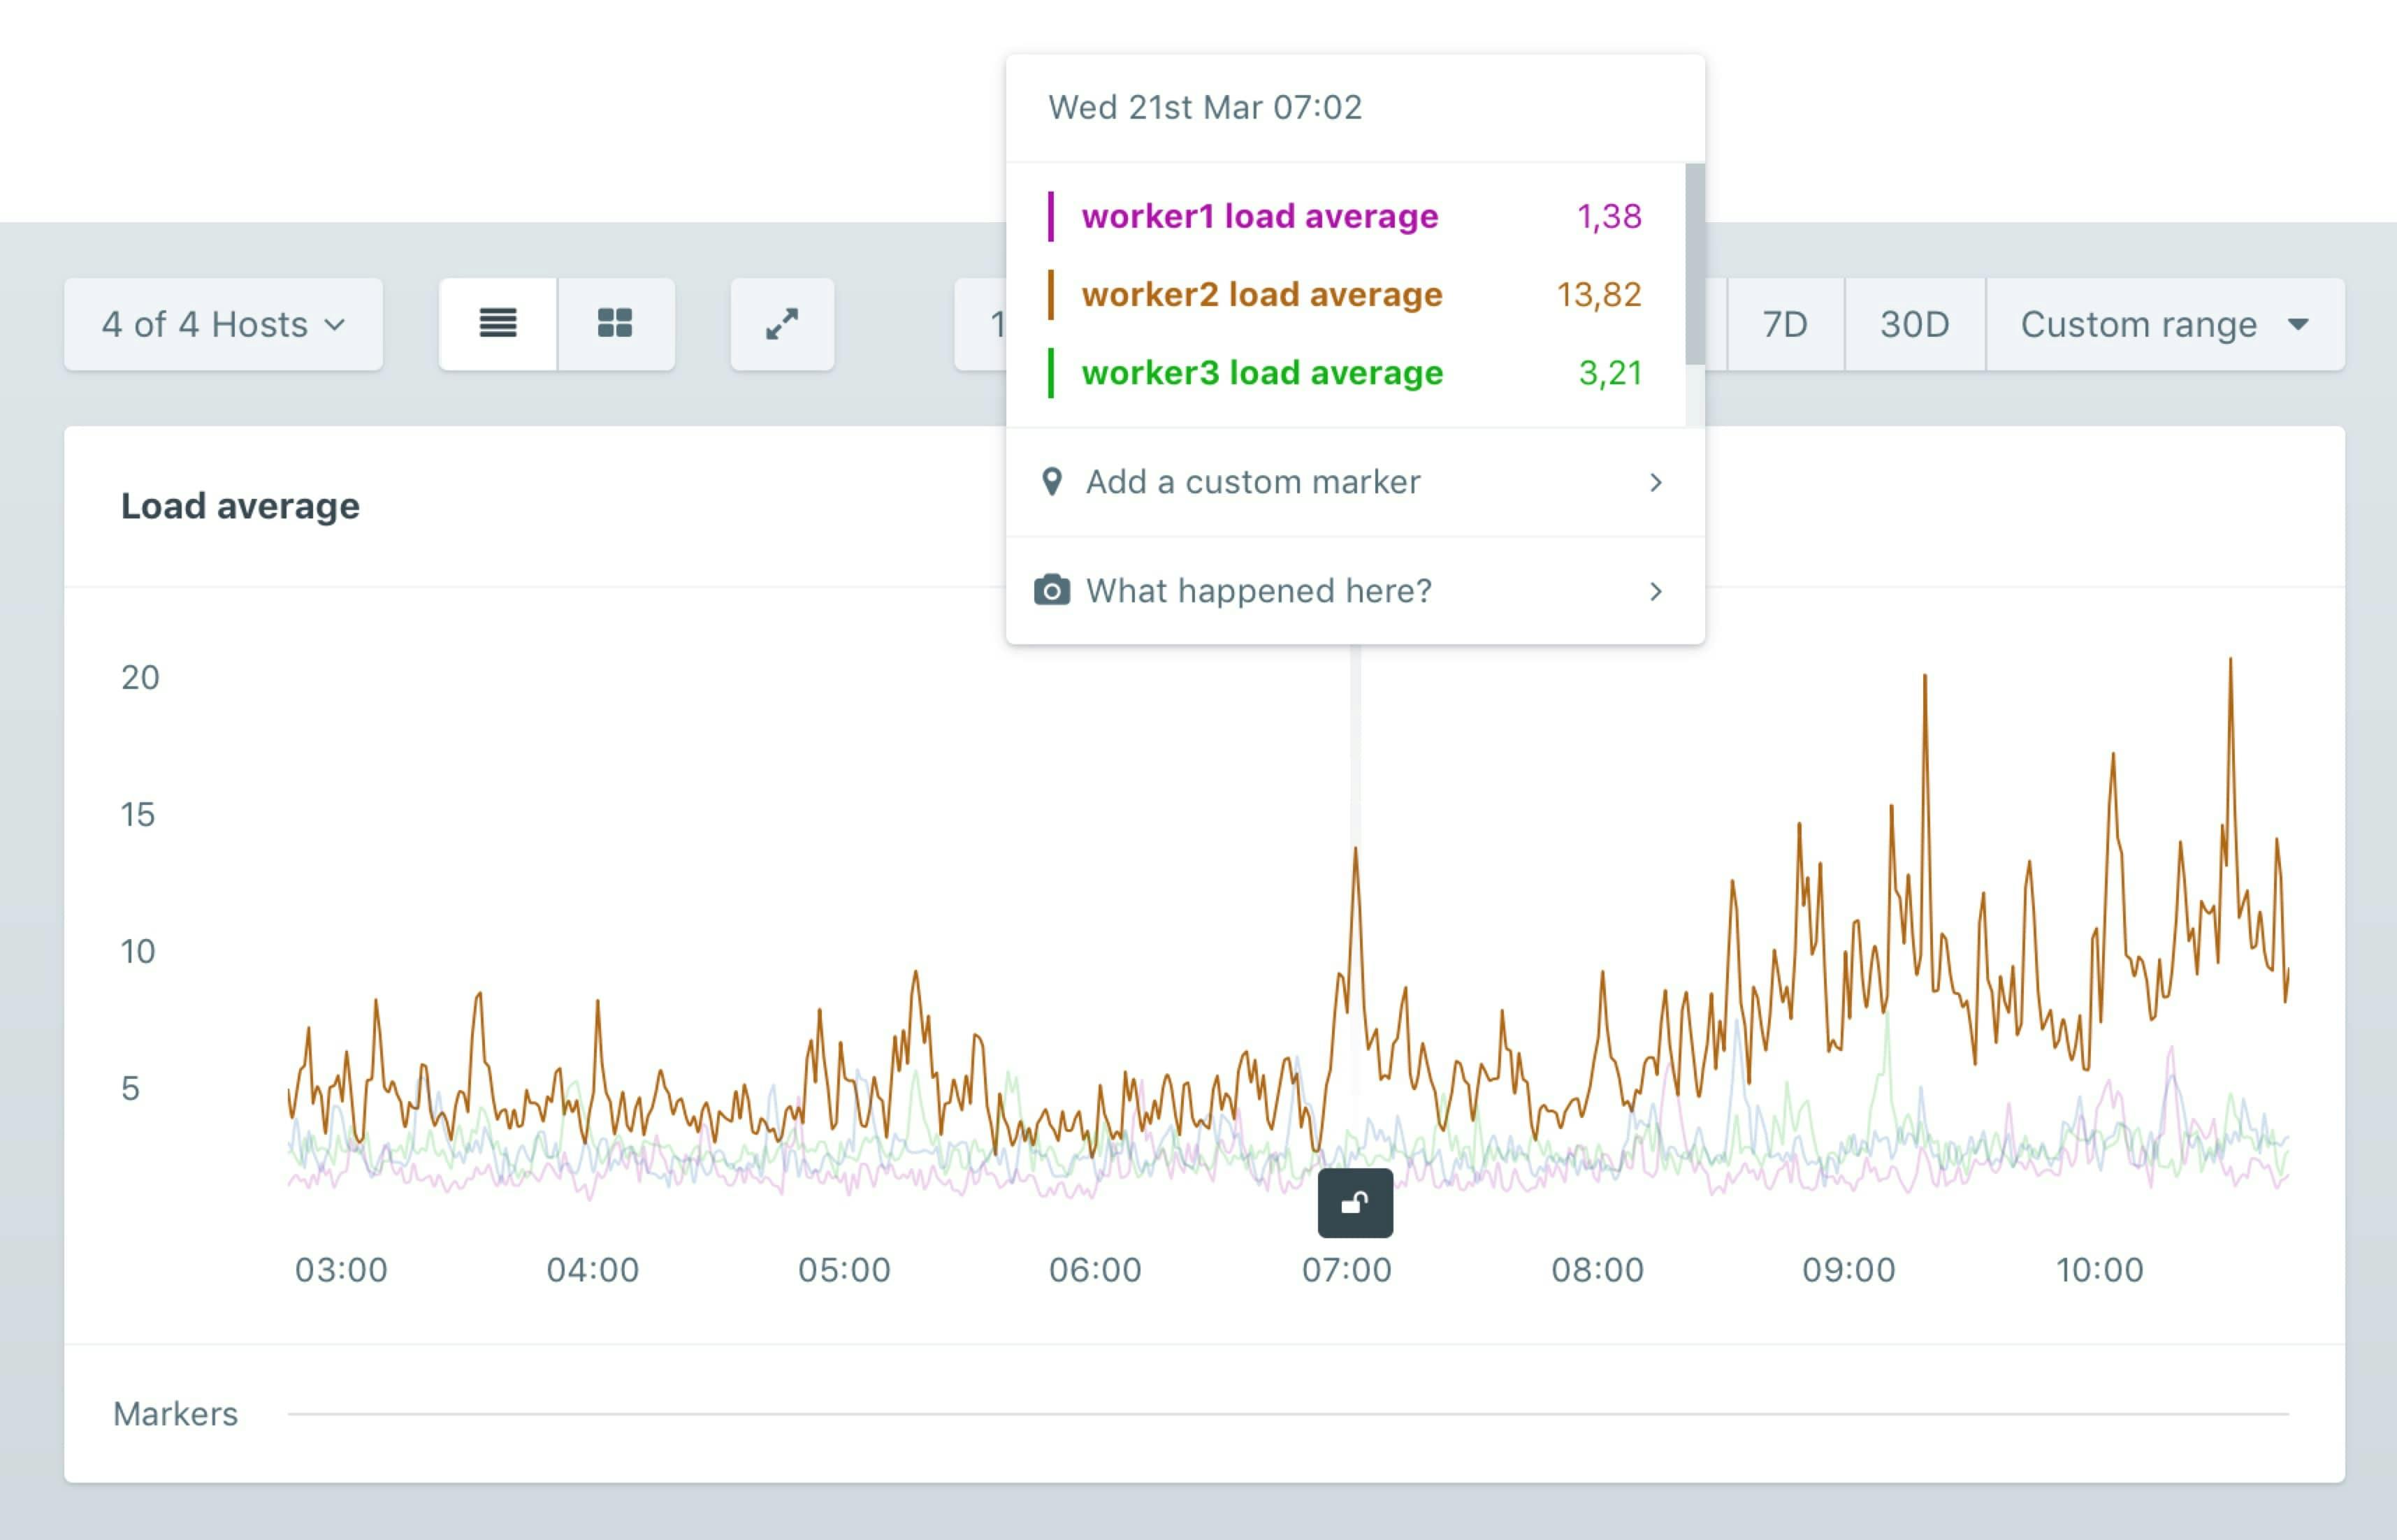
On AppSignal, load averages are shown by minute for the last eight hours, and per hour for timeframes longer than that.
System load
To understand what these load averages tell us (and when to be alarmed), we'll first need to understand what system load means, and how it's counted.
The load of a system is essentially the number of processes active at any given time. When idle, the load is 0. When a process starts, the load is incremented by 1. A terminating process decrements the load by 1. Besides running processes, any process that's queued up is also counted. So, when one process is actively using the CPU, and two are waiting their turn, the load is 3.
The load fluctuates quickly because of short-lived processes and can jump from zero to 5 in milliseconds and back again the next instant. Because of this volatility, it's more useful to look at the average load over time, which gives a better overview of the load the system has been under.
Load averages
Now that we know how system load is counted, we can take a look at load averages. As we've seen, the load the system is under is usually shown as an average over time.
Generally, single-core CPU can handle one process at a time. An average load of 1.0 would mean that one core is busy 100% of the time. If the load average drops to 0.5, the CPU has been idle for 50% of the time.
If the load average rises to 1.5, the CPU was busy all the time while there was (on average) one other process waiting for 50% of the time, giving the CPU more work than it can handle.
Logical processors
The general rule of thumb is that the load average shouldn't exceed the number of processors in the machine. If the number of processors is four, the load should generally stay under 4.0.
Keep in mind that this relates to logical processors instead of the actual physical ones on the CPU. Because of software abstractions like hyper-threading, the number of logical processors, or processing threads, can be higher than the number of physical processor cores.
To check the amount of logical processors on Linux, count the number of processors listed in /proc/cpuinfo, or grep processor /proc/cpuinfo | wc -l, which will print out the number of processor lines automatically.
On a mac, you can ask sysctl for the number of logical processors directly by using sysctl -n hw.ncpu.
For a system with multiple logical processors, the load average can grow higher, because it can run more concurrent processes. On a machine with two CPU cores, a load average of 2.0 means both CPUs were 100% utilized, while two processes were active on average.
Reading load averages
Since it's an average of the absolute number of processes, it can seem difficult to determine what a proper load average is, and when to be alarmed. In general, since each of your CPU cores can handle one process at a time, the system isn't overloaded until it goes over 1.0 per logical processors. On a dual-core system (without hyper-threading), that'd be 2.0.
Usually, it's fine if the load average is above 1.0 per core in the last minute mark, but elevated load in the five or fifteen-minute averages could indicate a problem.
TIP: AppSignal's anomaly detection can be used to open an alert you when your load average stays above a certain value for a period of time. Using the warm-up setting, we'll send you a message when your load stays above 1.5 for fifteen minutes, for example.
Did we answer your questions about load averages, or are there some parts still not quite clear? Please don't hesitate to let us know at @AppSignal. Of course, we'd love to know how you liked this article, or if you have another subject you'd like to know more about.