
Like a lot of people in the Ruby community, we were really impressed with Hongli's awesome work on finding out what causes Ruby memory bloat.
Last Wednesday he asked me if it would be possible to measure the effects of his proposed patch to Ruby with AppSignal. I realized this would be a great occasion to use our new Magic Dashboards feature. So we built and shipped a Magic Dashboard for process memory usage!
Upgrade to the latest Ruby or Elixir integration and you will be greeted by a new Magic Dashboard:
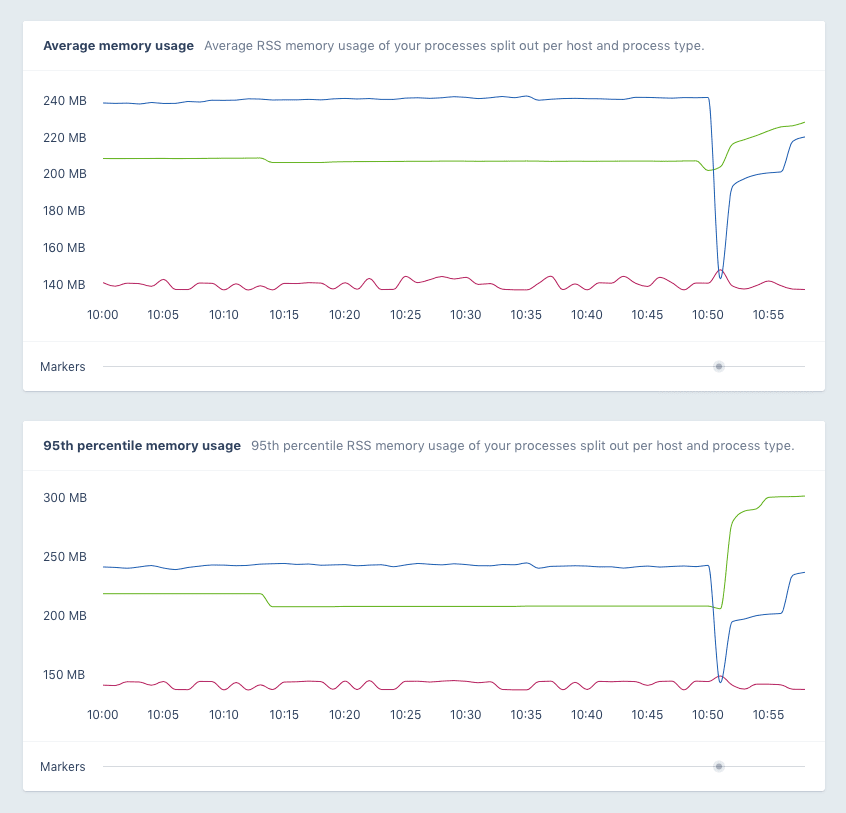
You'll see a graph of the average and 95th percentile usage per host and per type of process, so you can see the difference between eg. Sidekiq and Puma. If you run a single process, the average and 95th will be the same. If you run eg. a lot of Unicorn processes, you can see any spread in memory usage by comparing these two graphs. Of course you can use our performance monitoring features to see performance impact as well.
Enjoy!