

Last week, we had an issue with one of our Kafka brokers. Don't worry, it didn't impact any customers. When monitoring things closely, you can often solve things before they impact a customer ;-). In today's post, I'll show you how we use AppSignal to dogfood our own issues. I'll go through how we monitor the non-Ruby part of our stack and how we used AppSignal to detect and resolve the issue.
Our Stack
First, let's see how our data processing stack currently operates.
1[push] > [kafka] > [processor] > [kafka] > [database]We have multiple "Push" API nodes that accept payloads from the appsignal-agent. These nodes parse the (Protobuf) data and emit messages to Kafka on various topics. The push nodes accept HTTP payloads and store them on disk/in Redis to create a buffer in case there's an issue with Kafka.
A "processor" consumes these topics and aggregates the data. From there, it goes (through Kafka) to our databases.
Monitoring Non-Ruby/Elixir/Node Processes
The [push] and [processor] nodes can be monitored with an AppSignal language integration. Kafka servers run separately from the application code, so using a language integration is not possible. We still need insight into how Kafka operates though.
We use the standalone agent with the statsd option enabled and run jmxfetch to get JMX metrics from Kafka. You can read more about our setup here. Besides JMX Metrics, the standalone agent collects host metrics such as memory and CPU usage.
Detecting the Issue
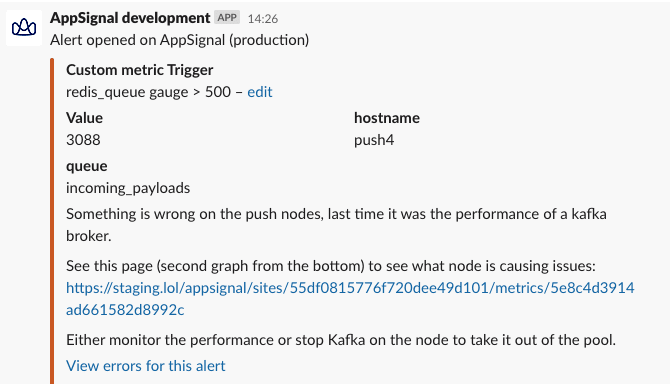
One sunny afternoon, we received several notifications in our #errors Slack channel. These came from our anomaly detection feature, where we monitor the queue size of our Push nodes.
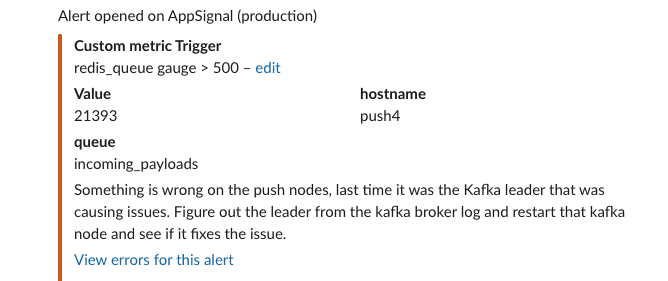
We use the "comment" feature for triggers to describe what set off the trigger and what to do to verify the issue or solve it immediately. After each issue, we update the comments to ensure that the next time it happens, the issue will be resolved more quickly. We're not afraid of placing large blocks of texts in there and linking to corresponding graphs on AppSignal.
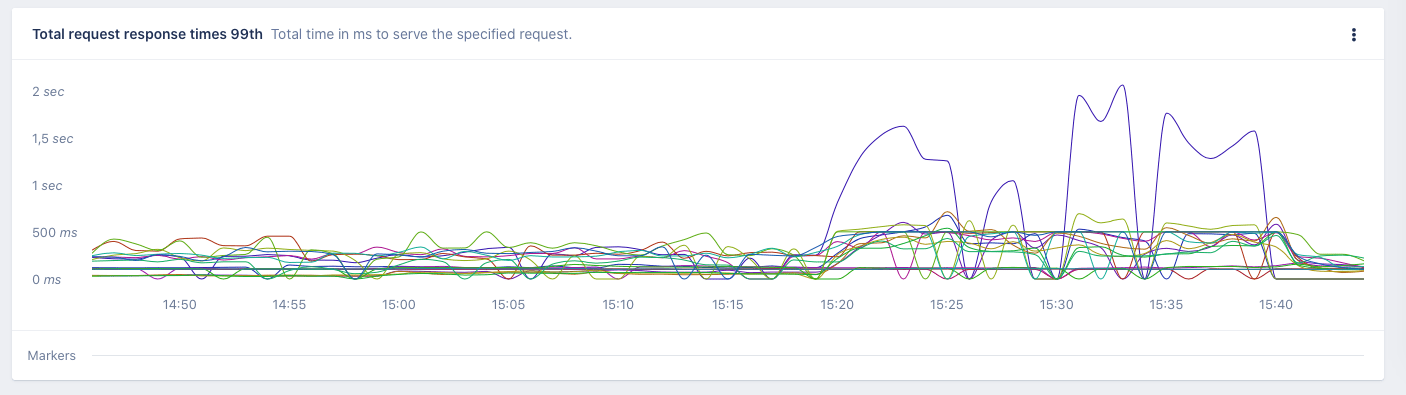
Diagnosing the Issue
With the alert in #errors, we started to investigate why queues were building up on the Push metrics. Thanks to the comment on the trigger, we quickly spotted one of the Kafka brokers taking a lot longer to commit messages than the others.
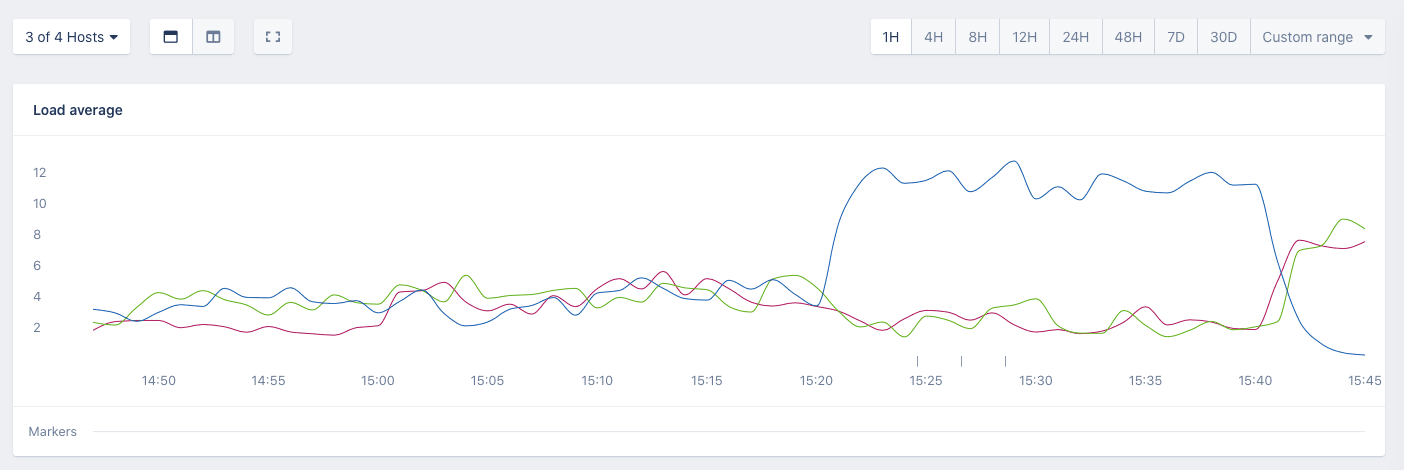
This corresponded with the Load average host metrics from that same machine.
Resolving the Issue
Knowing that one of the Kafka brokers was performing quite poorly, we notified our hosting provider of the issue (according to the hosting provider, it turned out that the issue was due to a partly broken physical memory on the machine).
So we took the Kafka broker out of the cluster, migrated it to a different machine soon after, and now, it's back to serving traffic again.
Prepare for Next Time
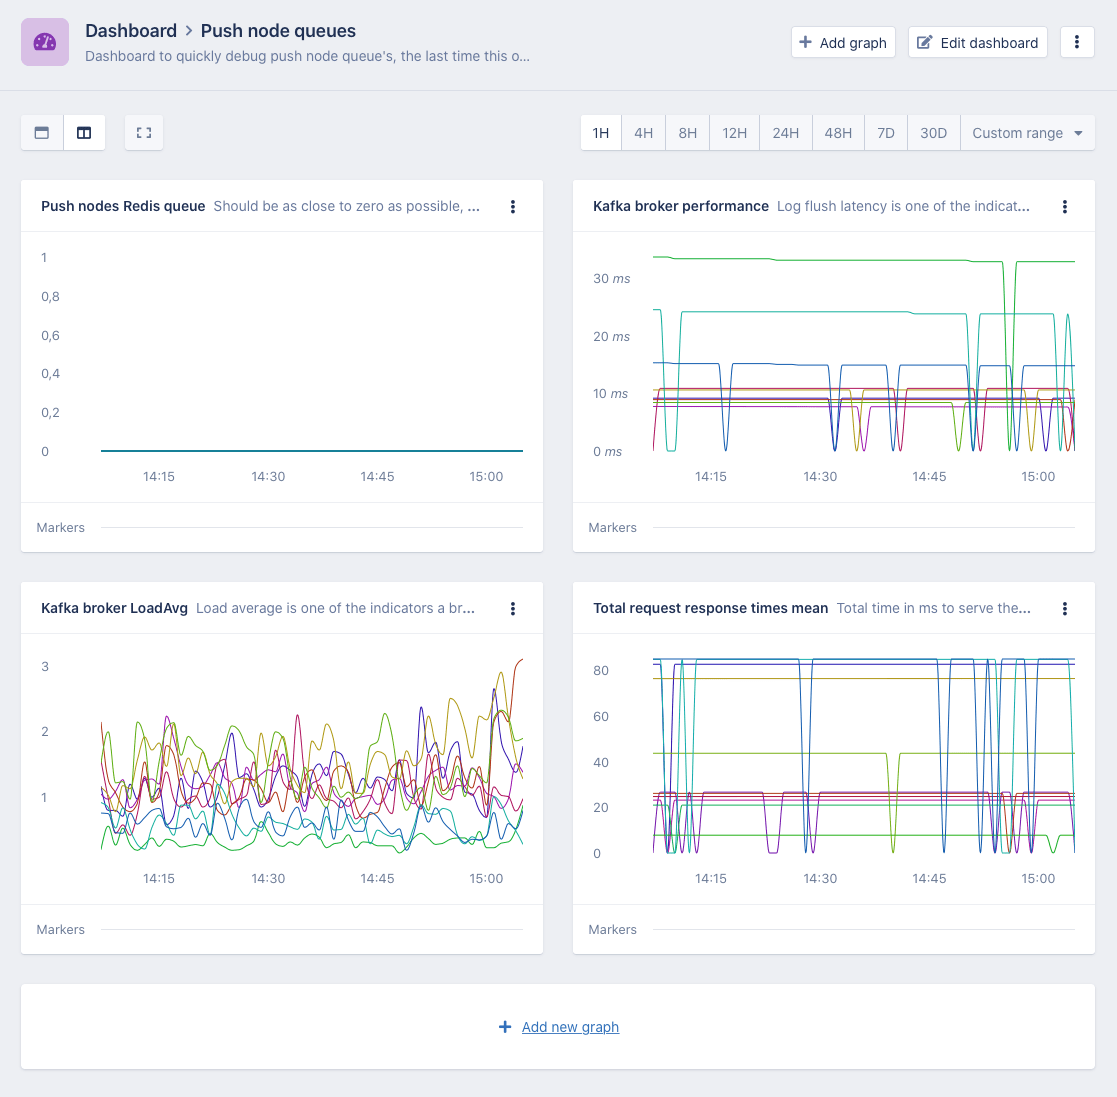
We've created a custom metrics dashboard with comments on each graph that allows us to easily correlate push node queue size with Kafka (and Kafka host) performance the next time this issue might occur.
From our experience as a consulting company, before starting AppSignal, we learned that Application monitoring is only part of what's needed to run a SAAS company (or any web app/site, for that matter) and we've always thought that it's important to get a complete overview of all the moving parts involved in an application.
Monitoring external services such as—in this case—Kafka, in the same tool as application metrics makes it easy to connect the dots over the entire stack, including the hosts it runs on, and allows us to quickly resolve issues without having to open dozens of separate tools.
All the data is in the same format, with the same resolution and timeframe, and can be found/linked in once place.
PS If you like our approach of making an APM that is easy to use, as well as very configurable once you are up and running, try us out for free. If you only want to read the blog, that makes us happy too, and we wouldn't stop you if you shared this content 🤪.