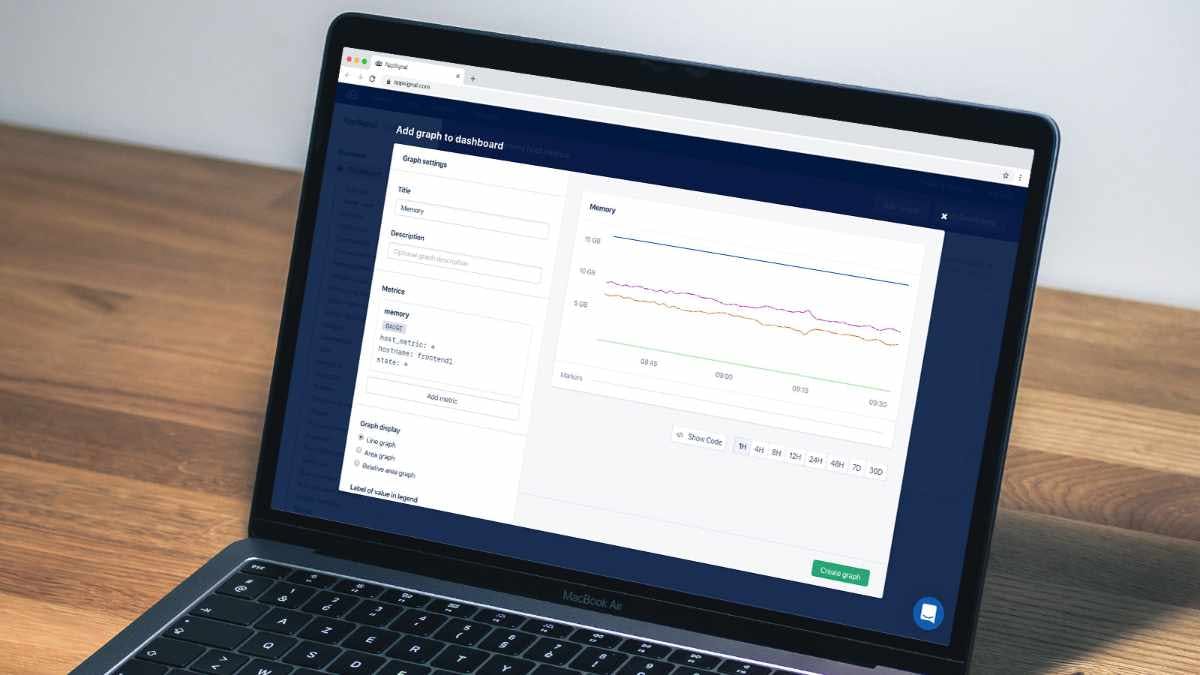
Dashboards should be easy to build and provide powerful insights. Our magic dashboards are already created automatically, so you don't have to spend any time setting up these dashboards yourself.
Many developers started tracking custom metrics that were unique to their applications. From these metrics, you can create custom dashboards and add triggers to get notified if values go outside of your desired range. We use these custom metrics ourselves to monitor our MongoDB replica set lag, for example.
From YAML to a Graph Builder
Our aim for AppSignal features is that they should be quick to set up, easy to use, and customizable for experienced users. With that goal in mind, we've built our new graph builder: an intuitive and quick way to add new graphs to your dashboards. It is an addition to the powerful YAML editor (which will stay available).
The best feature in the new graph builder is instantly seeing the results of your configuration. You can add metrics and tags to your graphs (both are autocompleting now), and see the updates on the screen instantly. After you've added your graph lines, you can configure the graph options to make legends and data labels display the correct way.
The new graph builder means no more back and forth between docs, the YAML editor, and your code, but straightforward graph building.
More to Come
Our mission to make our dashboards easier to build continues. First, we'll enable the graph builder for existing graphs. Will you let us know what you want to see next?
Now, if you'll excuse us, we're gonna go and play around with our new graph builder now.
