


In this post, we will explore memory heap allocation in Node and push local hardware to its limit. Then we will find practical ways to monitor Node processes to debug memory issues.
Ready? Let’s get going!
To follow along, you can clone the code from my GitHub.
An Introduction to V8 Garbage Collection
First, a bit of an introduction to the V8 garbage collector. The heap is where memory allocations go, and it is divided up into several generational regions. The regions are simply called generations, and objects belong to a generation as they age throughout their lifetime.
There is a young generation and an old generation. Young objects are further split up into nursery and intermediate sub-generations. As objects survive garbage collection, they join the older generation.
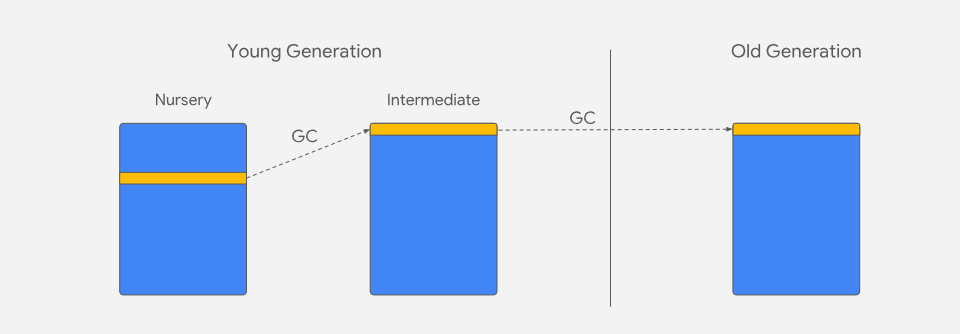
Source: https://v8.dev/_img/trash-talk/02.svg
The basic principle in the generational hypothesis is that most objects die young. The V8 garbage collector is designed to exploit this fact and only promotes objects that survive garbage collection. As objects get copied into adjacent regions, they eventually end up in an old generation.
There are three major areas in Node memory consumption:
- Code - where the code that's executed goes
- Call stack - for functions and local variables with primitive types like number, string, or boolean
- Heap memory
Heap memory is our main focus today.
Now that you know more about the garbage collector, it's time to allocate some memory on the heap!
1function allocateMemory(size) {
2  // Simulate allocation of bytes
3  const numbers = size / 8;
4  const arr = [];
5  arr.length = numbers;
6  for (let i = 0; i < numbers; i++) {
7    arr[i] = i;
8  }
9  return arr;
10}
Local variables die young and as soon as the function call ends within the call stack. Primitives like numbers never make it to the heap and are allocated in the call stack instead. The object arr will go in the heap and likely survive garbage collection.
Are There Any Limits to Heap Memory?
Now for a test of bravery — push the Node process to its maximum capacity and see where it runs out of heap memory:
1const memoryLeakAllocations = [];
2
3const field = "heapUsed";
4const allocationStep = 10000 * 1024; // 10MB
5
6const TIME_INTERVAL_IN_MSEC = 40;
7
8setInterval(() => {
9  const allocation = allocateMemory(allocationStep);
10
11  memoryLeakAllocations.push(allocation);
12
13  const mu = process.memoryUsage();
14  // # bytes / KB / MB / GB
15  const gbNow = mu[field] / 1024 / 1024 / 1024;
16  const gbRounded = Math.round(gbNow * 100) / 100;
17
18  console.log(`Heap allocated ${gbRounded} GB`);
19}, TIME_INTERVAL_IN_MSEC);
This allocates around 10 megabytes with an interval of 40 milliseconds, which gives enough time for garbage collection to promote surviving objects to the old generation. process.memoryUsage is a crude tool that gathers metrics around heap utilization. As heap allocations grow, the heapUsed field tracks the size of the heap. This heap field reports the number of bytes in RAM, which can be converted to gigabytes.
Your results may vary. A Windows 10 laptop with 32GB of memory yields this result:
1Heap allocated 4 GB
2Heap allocated 4.01 GB
3
4<--- Last few GCs --->
5
6[18820:000001A45B4680A0] 26146 ms: Mark-sweep (reduce) 4103.7 (4107.3) -> 4103.7 (4108.3) MB, 1196.5 / 0.0 ms (average mu = 0.112, current mu = 0.000) last resort GC in old space requested
7
8<--- JS stacktrace --->
9
10FATAL ERROR: CALL_AND_RETRY_LAST Allocation failed - JavaScript heap out of memory
Here, the garbage collector attempts to compact memory as a last resort before giving up and throwing a 'heap out of memory' exception. This process hits a 4.1GB limit and takes 26.6 seconds to realize it was time to die.
The reasons for this are somewhat unknown. The V8 garbage collector originally ran in a 32-bit browser process with strict memory restrictions. These results suggest that the memory limit might have carried over from legacy code.
At the time of writing, the script ran under the latest LTS Node version and is using a 64-bit executable. Theoretically, a 64-bit process should be able to allocate more than 4GB and grow comfortably well into 16 terabytes of address space.
Expanding Memory Allocation Limits
The V8 garbage collector has a --max-old-space-size parameter available to the Node executable:
1node index.js --max-old-space-size=8000This sets the max limit to 8GB. Be careful when doing this. My laptop has ample room with 32GB. I recommend setting this to however much room is physically available in your RAM. Once physical memory runs out, the process starts to eat disk space via virtual memory. If you set the limit too high, you might find a way to damage your PC! The goal here is to avoid smoke coming out of the machine.
With 8GB to burn, test the new limit:
1Heap allocated 7.8 GB
2Heap allocated 7.81 GB
3
4<--- Last few GCs --->
5
6[16976:000001ACB8FEB330] 45701 ms: Mark-sweep (reduce) 8000.2 (8005.3) -> 8000.2 (8006.3) MB, 1468.4 / 0.0 ms (average mu = 0.211, current mu = 0.000) last resort GC in old space requested
7
8<--- JS stacktrace --->
9
10FATAL ERROR: CALL_AND_RETRY_LAST Allocation failed - JavaScript heap out of memory
The heap size almost makes it to 8GB, but not quite. I suspect there is some overhead within the Node process to allocate this much memory. This time it takes 45.7 seconds for the process to die.
In production, it likely won’t take less than a minute to run out of memory. This is one reason why monitoring and having insight into memory consumption helps. Memory consumption can grow slowly over time, and it could take days before you know there is a problem. If the process keeps crashing and this 'heap out of memory' exception shows up in the logs, there might be a memory leak in the code.
The process might also chew on more memory because it is working with more data. If resource consumption continues to grow, it might be time to break this monolith into microservices. This will reduce memory pressure on a single process and allow nodes to scale horizontally.
How to Keep Track of Node.js Memory Leaks
The process.memoryUsage function via the heapUsed field is somewhat useful. One way to debug memory leaks is to put memory metrics in another tool for further processing. Because this implementation is not sophisticated, the analysis will remain mostly a manual process.
Put this right above the setInterval call in the code:
1const path = require("path");
2const fs = require("fs");
3const os = require("os");
4
5const start = Date.now();
6const LOG_FILE = path.join(__dirname, "memory-usage.csv");
7
8fs.writeFile(LOG_FILE, "Time Alive (secs),Memory GB" + os.EOL, () => {}); // fire-and-forget
To avoid putting heap allocation metrics in memory, let's opt to write to a CSV file for easy data consumption. This uses the async writeFile function with a callback. The callback is left empty to write to the file and continue without any further processing.
To grab gradual memory metrics, add this above the console.log:
1const elapsedTimeInSecs = (Date.now() - start) / 1000;
2const timeRounded = Math.round(elapsedTimeInSecs * 100) / 100;
3
4s.appendFile(LOG_FILE, timeRounded + "," + gbRounded + os.EOL, () => {}); // fire-and-forget
With this code, you can debug memory leaks as heap utilization grows over time. You can use any tool that will analyze raw CSV data and show a nice visual.
If you're in a hurry and just want to see some data, Excel does the trick:
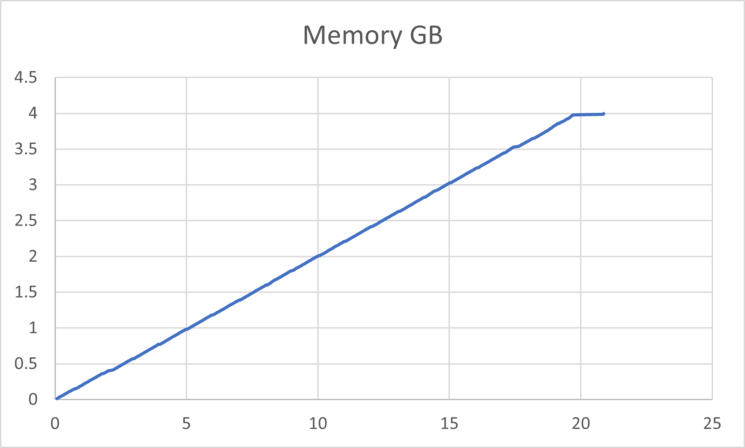
You can see a linear increase in memory usage over a short time with the 4.1GB limit. Memory consumption continues to grow and does not plateau, which shows there is a memory leak somewhere. When debugging these kinds of memory issues, look for code that causes the allocations to end up in the old generation. Objects that survive garbage collection likely hang around until the process dies.
One way to make this memory leak detection code more reusable is to wrap it around its own interval (since it does not have to live inside the main loop).
1setInterval(() => {
2  const mu = process.memoryUsage();
3  // # bytes / KB / MB / GB
4  const gbNow = mu[field] / 1024 / 1024 / 1024;
5  const gbRounded = Math.round(gbNow * 100) / 100;
6
7  const elapsedTimeInSecs = (Date.now() - start) / 1000;
8  const timeRounded = Math.round(elapsedTimeInSecs * 100) / 100;
9
10  fs.appendFile(LOG_FILE, timeRounded + "," + gbRounded + os.EOL, () => {}); // fire-and-forget
11}, TIME_INTERVAL_IN_MSEC);
Keep in mind this is not production-ready but only shows how to debug memory leaks in local code. An actual implementation will include automatic visuals, alerting, and rotating the logs, so the server does not run out of disk space.
Keep Track of Node.js Memory Leaks in Production
Although the above code isn't viable for production environments, we've seen how to debug some memory leaks. So, as an alternative, the Node process can be wrapped around a daemon process like PM2.
Set a restart strategy when memory consumption hits a limit:
1pm2 start index.js --max-memory-restart 8GUnits can be K (kilobyte), M (megabyte), and G (gigabyte). It takes about 30 seconds before the process restarts, so have multiple nodes via a load balancer to avoid outages.
Another nifty tool is the platform-independent native module node-memwatch which fires an event when it detects a memory leak in running code.
1const memwatch = require("memwatch");
2
3memwatch.on("leak", function (info) {
4  // event emitted
5  console.log(info.reason);
6});
The event is emitted via leak, and the callback object has a reason with the heap growth over consecutive garbage collections.
Diagnose Memory Limits with AppSignal's Magic Dashboard
AppSignal has a magic dashboard for garbage collection stats that monitor heap growth.
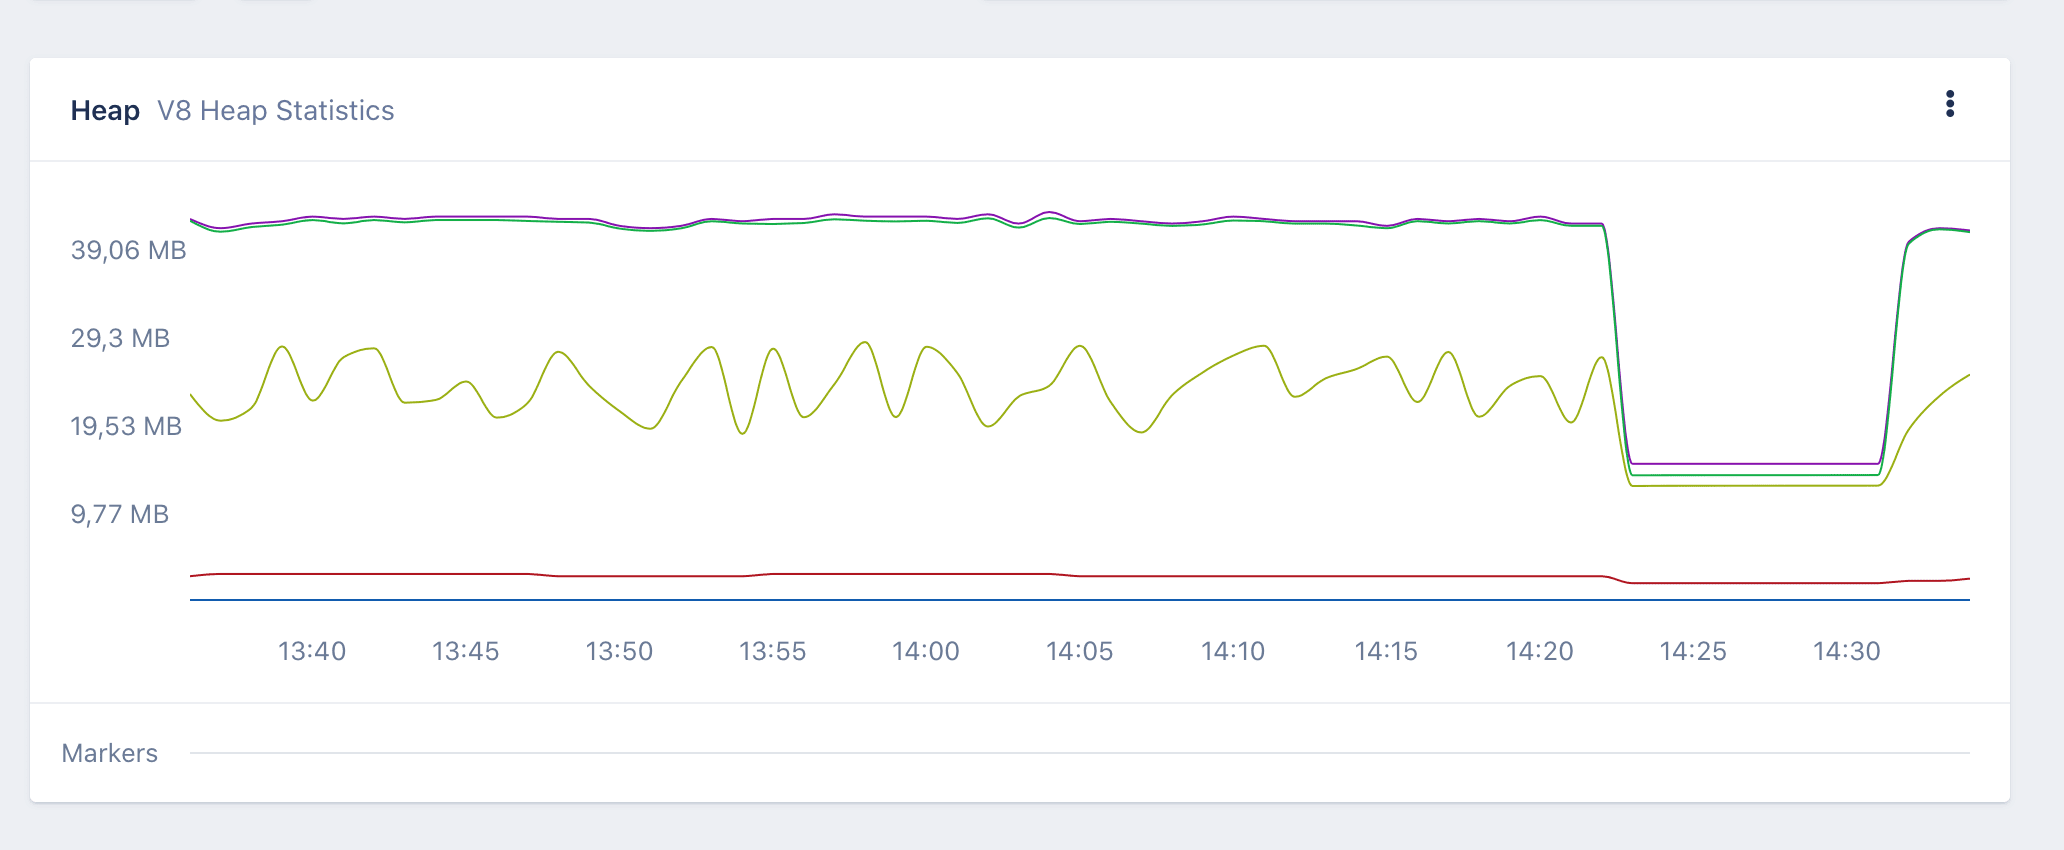
The above shows that requests stopped for seven minutes around 14:25, and garbage collection was allowed to reduce memory pressure. The dashboard will also show when objects hang around old space for too long and cause a memory leak.
Sum Up: Tackle Node.js Memory Limits and Leaks
In this post, we started by looking at what the V8 garbage collector does before exploring whether there are limits to heap memory and how to expand memory allocation limits.
Finally, we examined some potential tools to keep tabs on memory leaks in your Node.js app. We saw that memory allocation monitoring is possible by using crude tools like memoryUsage with some debugging techniques. Here, analysis remains a manual process.
Another alternative is to use professional tools like AppSignal, which offers monitoring, alerting, and nice visuals to diagnose memory problems in real-time.
I hope you've enjoyed this quick introduction to memory limits and diagnosing memory leaks.
Now get coding!
P.S. If you liked this post, subscribe to our JavaScript Sorcery list for a monthly deep dive into more magical JavaScript tips and tricks.
P.P.S. If you need an APM for your Node.js app, go and check out the AppSignal APM for Node.js.


