Today’s release of Node.js integration supports PostgreSQL as well as all the consumers of the pg library.
Doing the Instrumentation FOR You
AppSignal does as much work as it can for you. We aim for your whole stack to be automatically instrumented, so that you can spend your time writing and improving code. We love products that put the user’s convenience over the maker’s, so that’s what we have done with AppSignal as well. You can install AppSignal in 5 minutes and get a lot of things instrumented right away.
In the coming weeks, we will be rolling out a whole array of integrations on Node.js one by one. This means that more and more parts will be instrumented without you doing any work. Well, except upgrading to the latest AppSignal npm package and installing the pg plugin. Check out our documentation to get going.
AppSignal's combination of error tracking, performance monitoring, host metrics and custom metric dashboards helps you solve your issues seamlessly. All of these things work out of the box for Node.js.
Improving Performance with AppSignal's PostgreSQL Integration
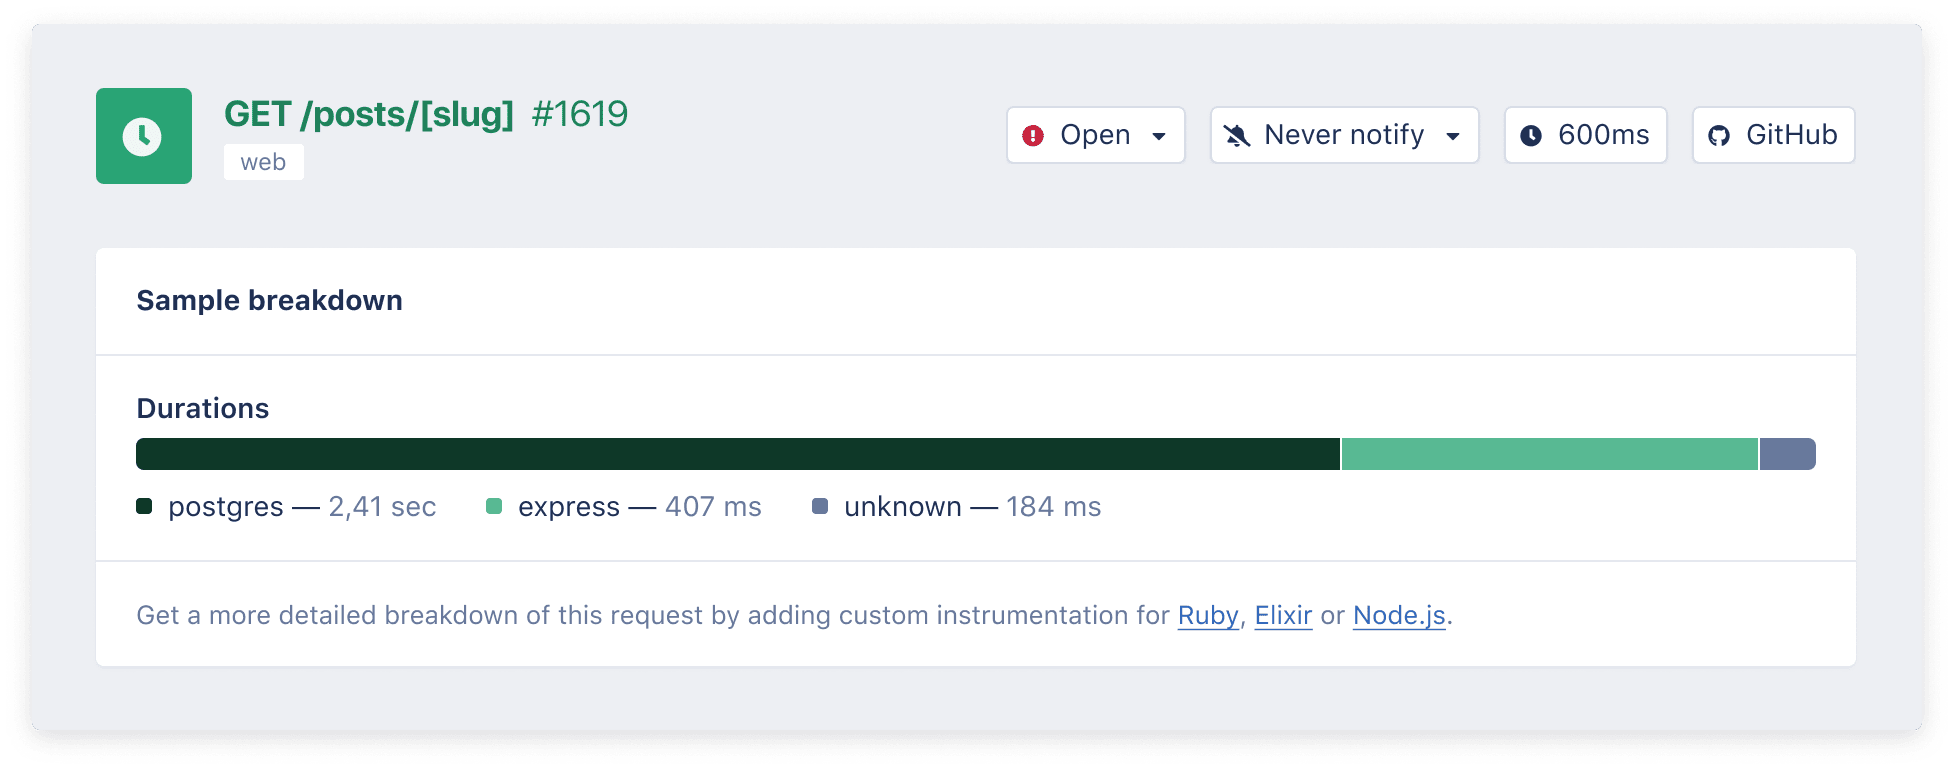
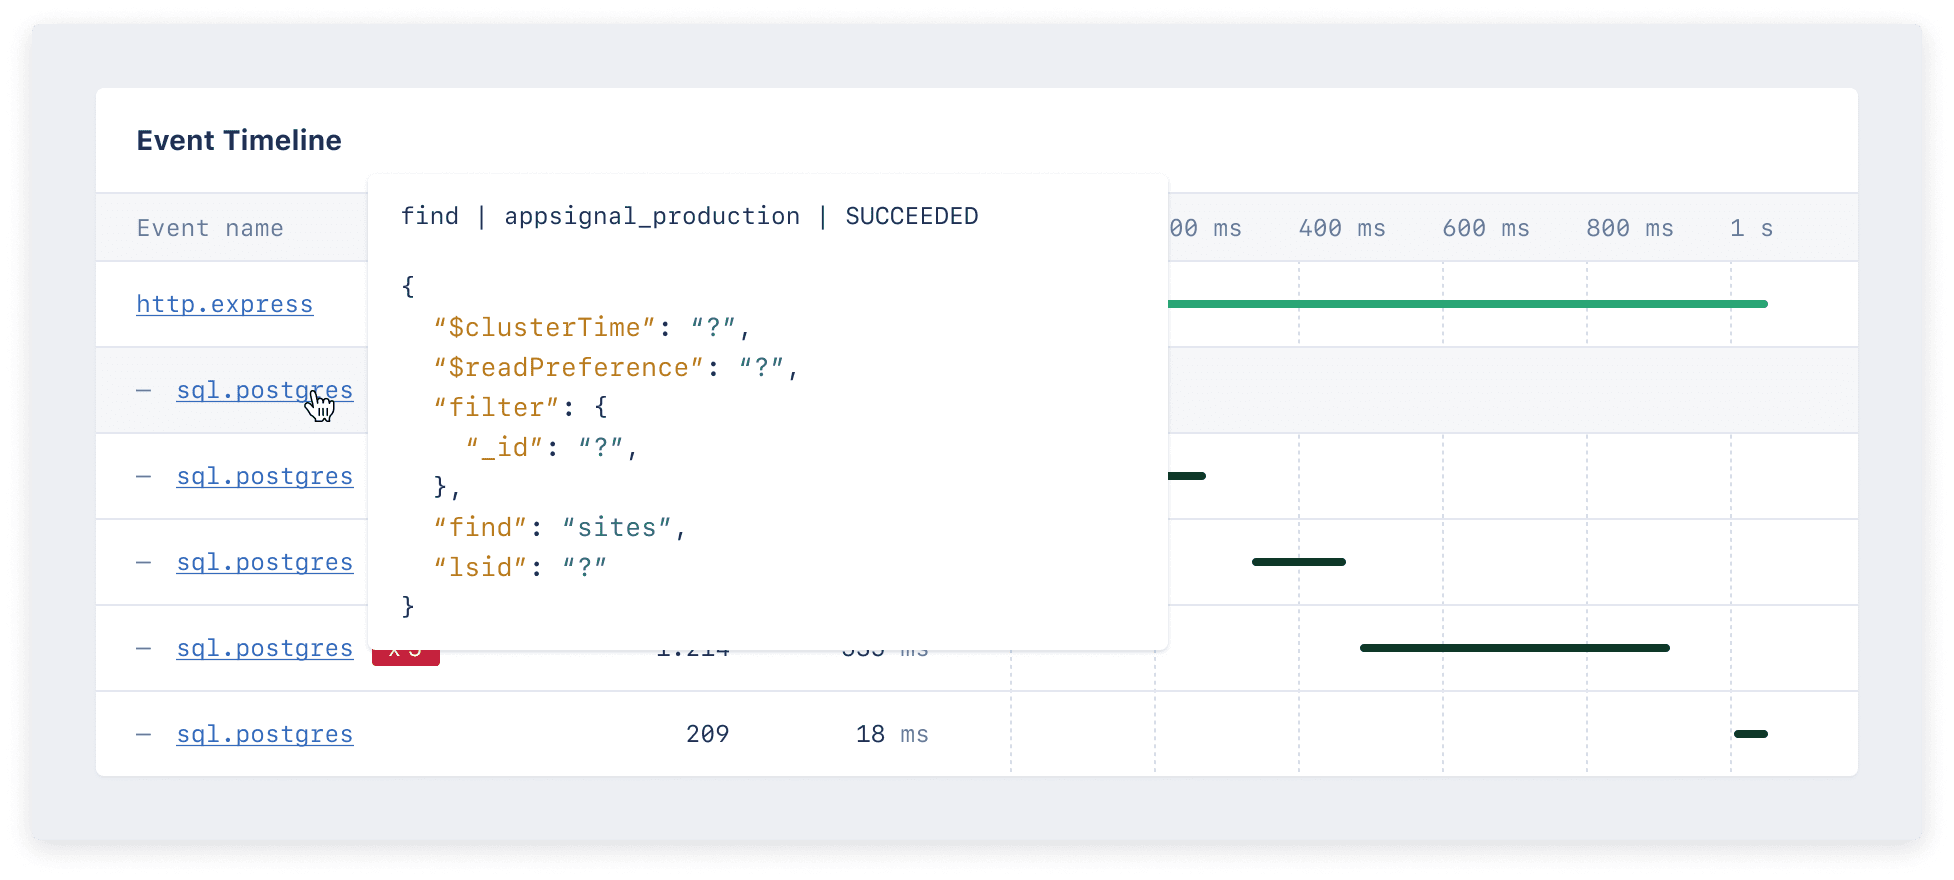
With today’s integration update, you will see a more detailed breakdown of the events within a particular request. Today’s release enables this for knex, bookshelfjs, typeORM and all other consumers of the pg library. Here’s an example where you can see the duration of a PostgreSQL process within a sample:
If we zoom in further on the performance of this sample, further down the page you'll find a timeline of all events. This now has your PostgreSQL consumers detailed.
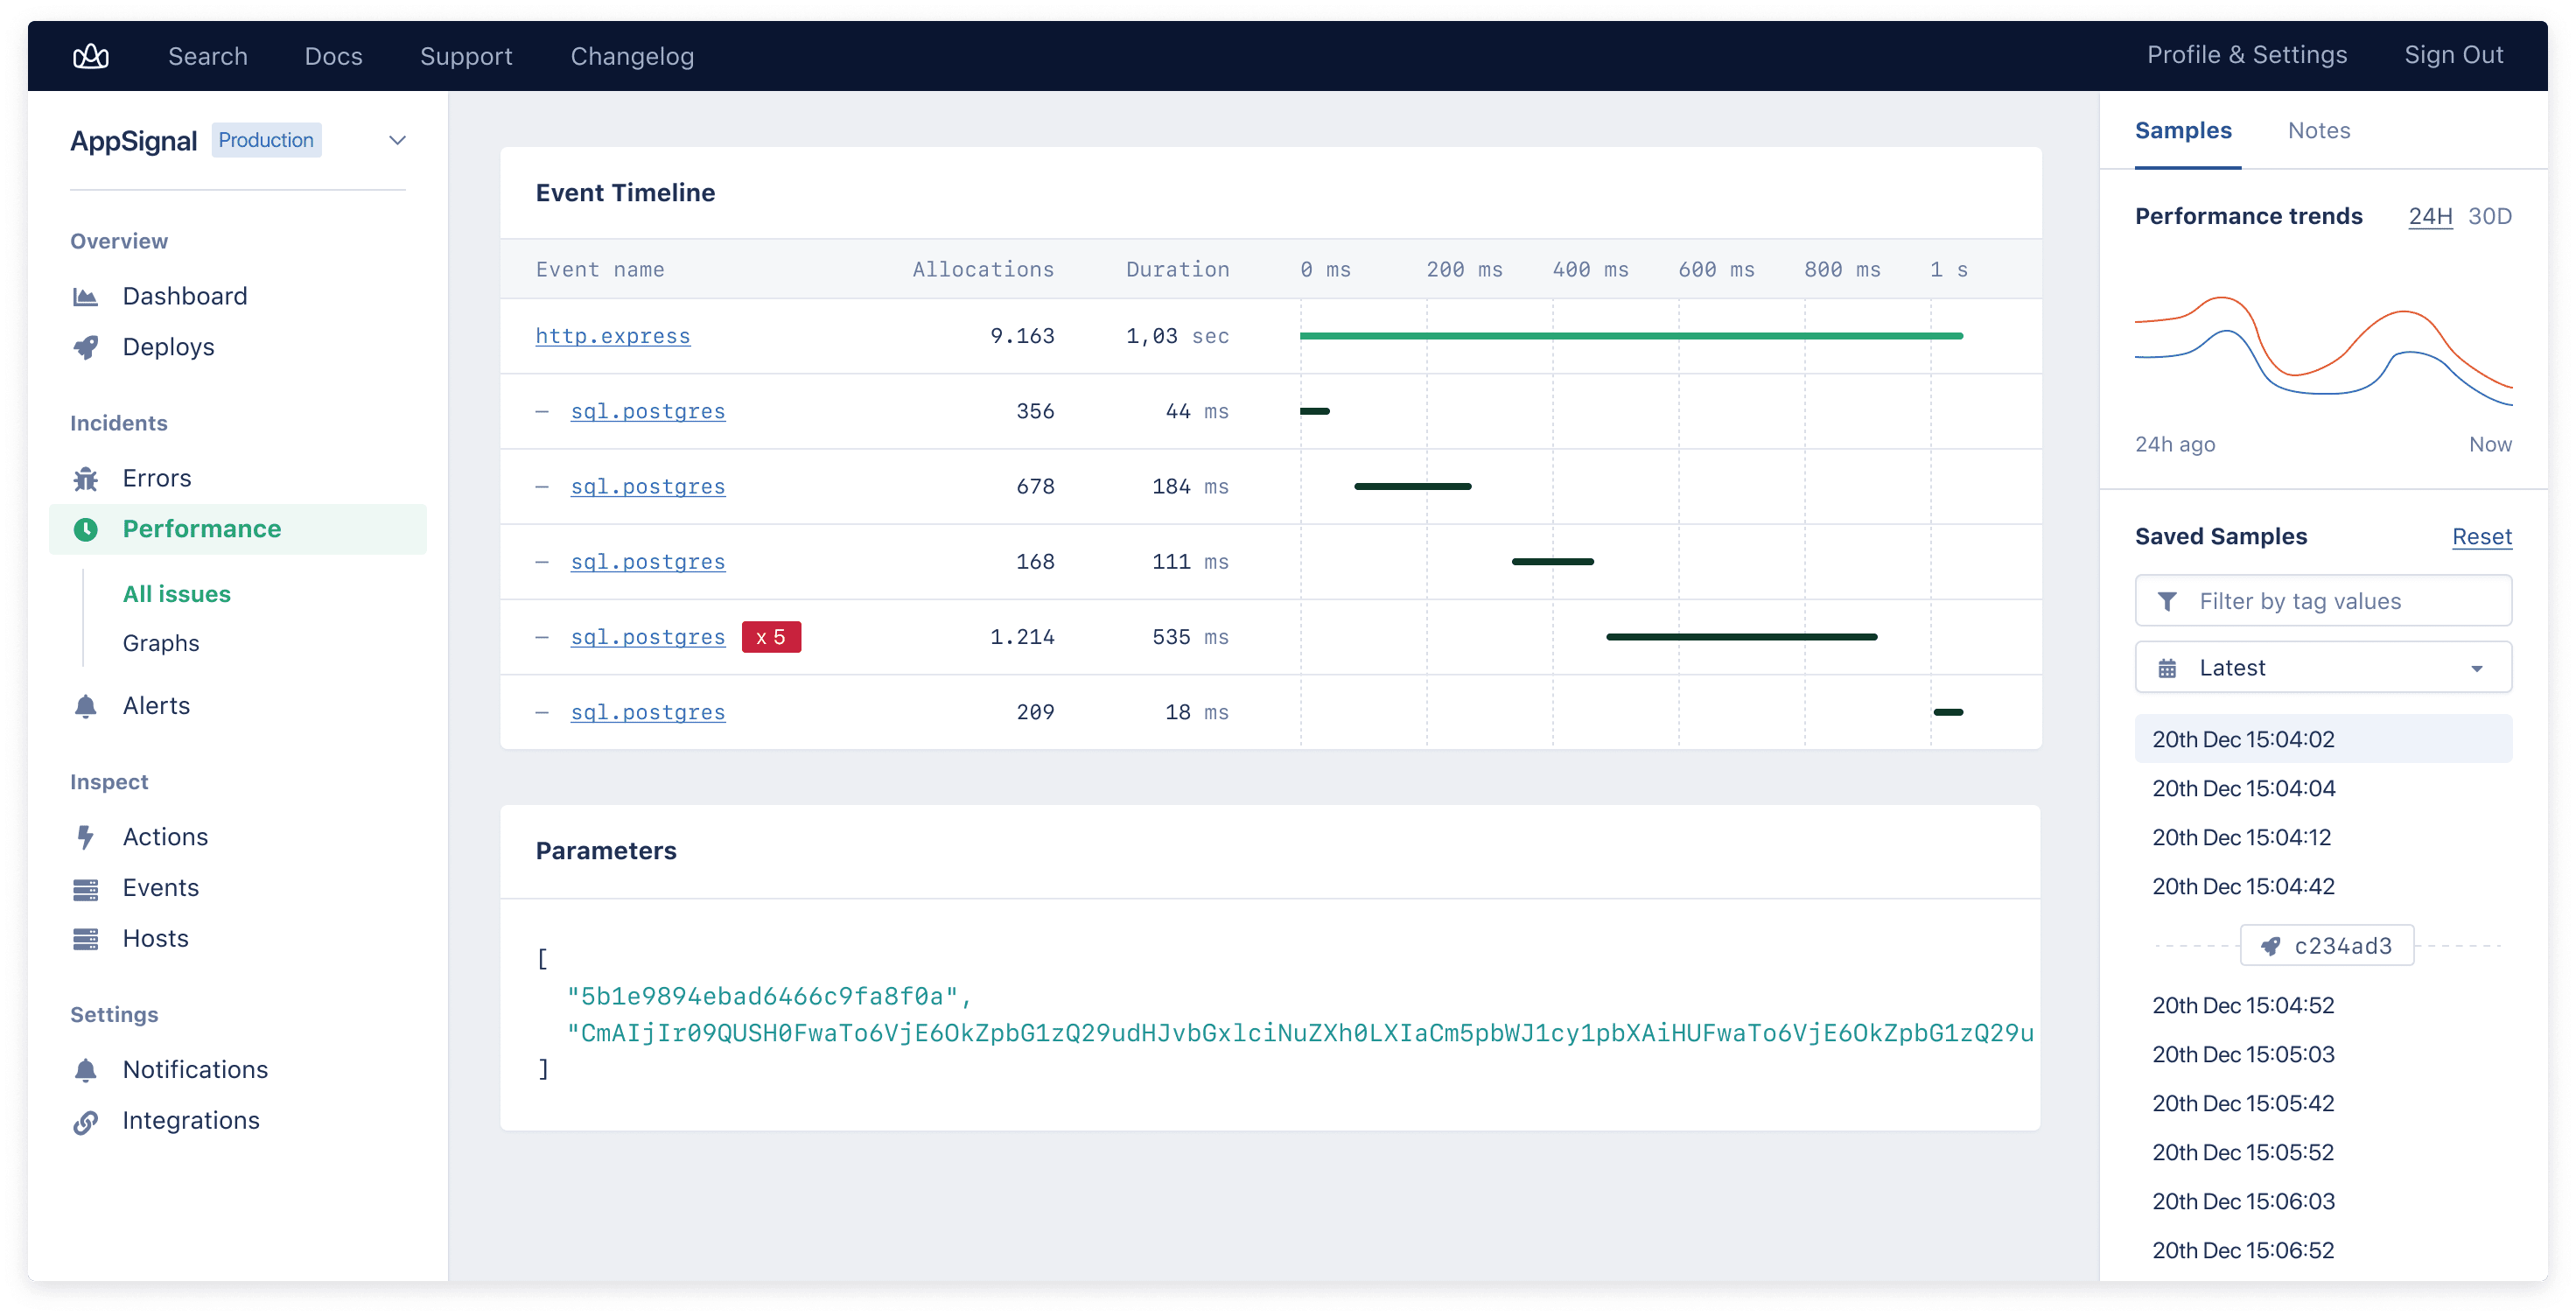
The integration shows you the tracing for database calls, so you can see what query is the root of your evil (or genius) 😉.
If the root of some evil turns out to be a repeated database query know as an N+1 query, we specifically label those so that it’s easier to find. On the
performance sample screen we looked at before, you can then see what role they play in the timeline for that sample. For example, it can show N+32 there, so you immediately get a glance on how much lazy loading led to this.
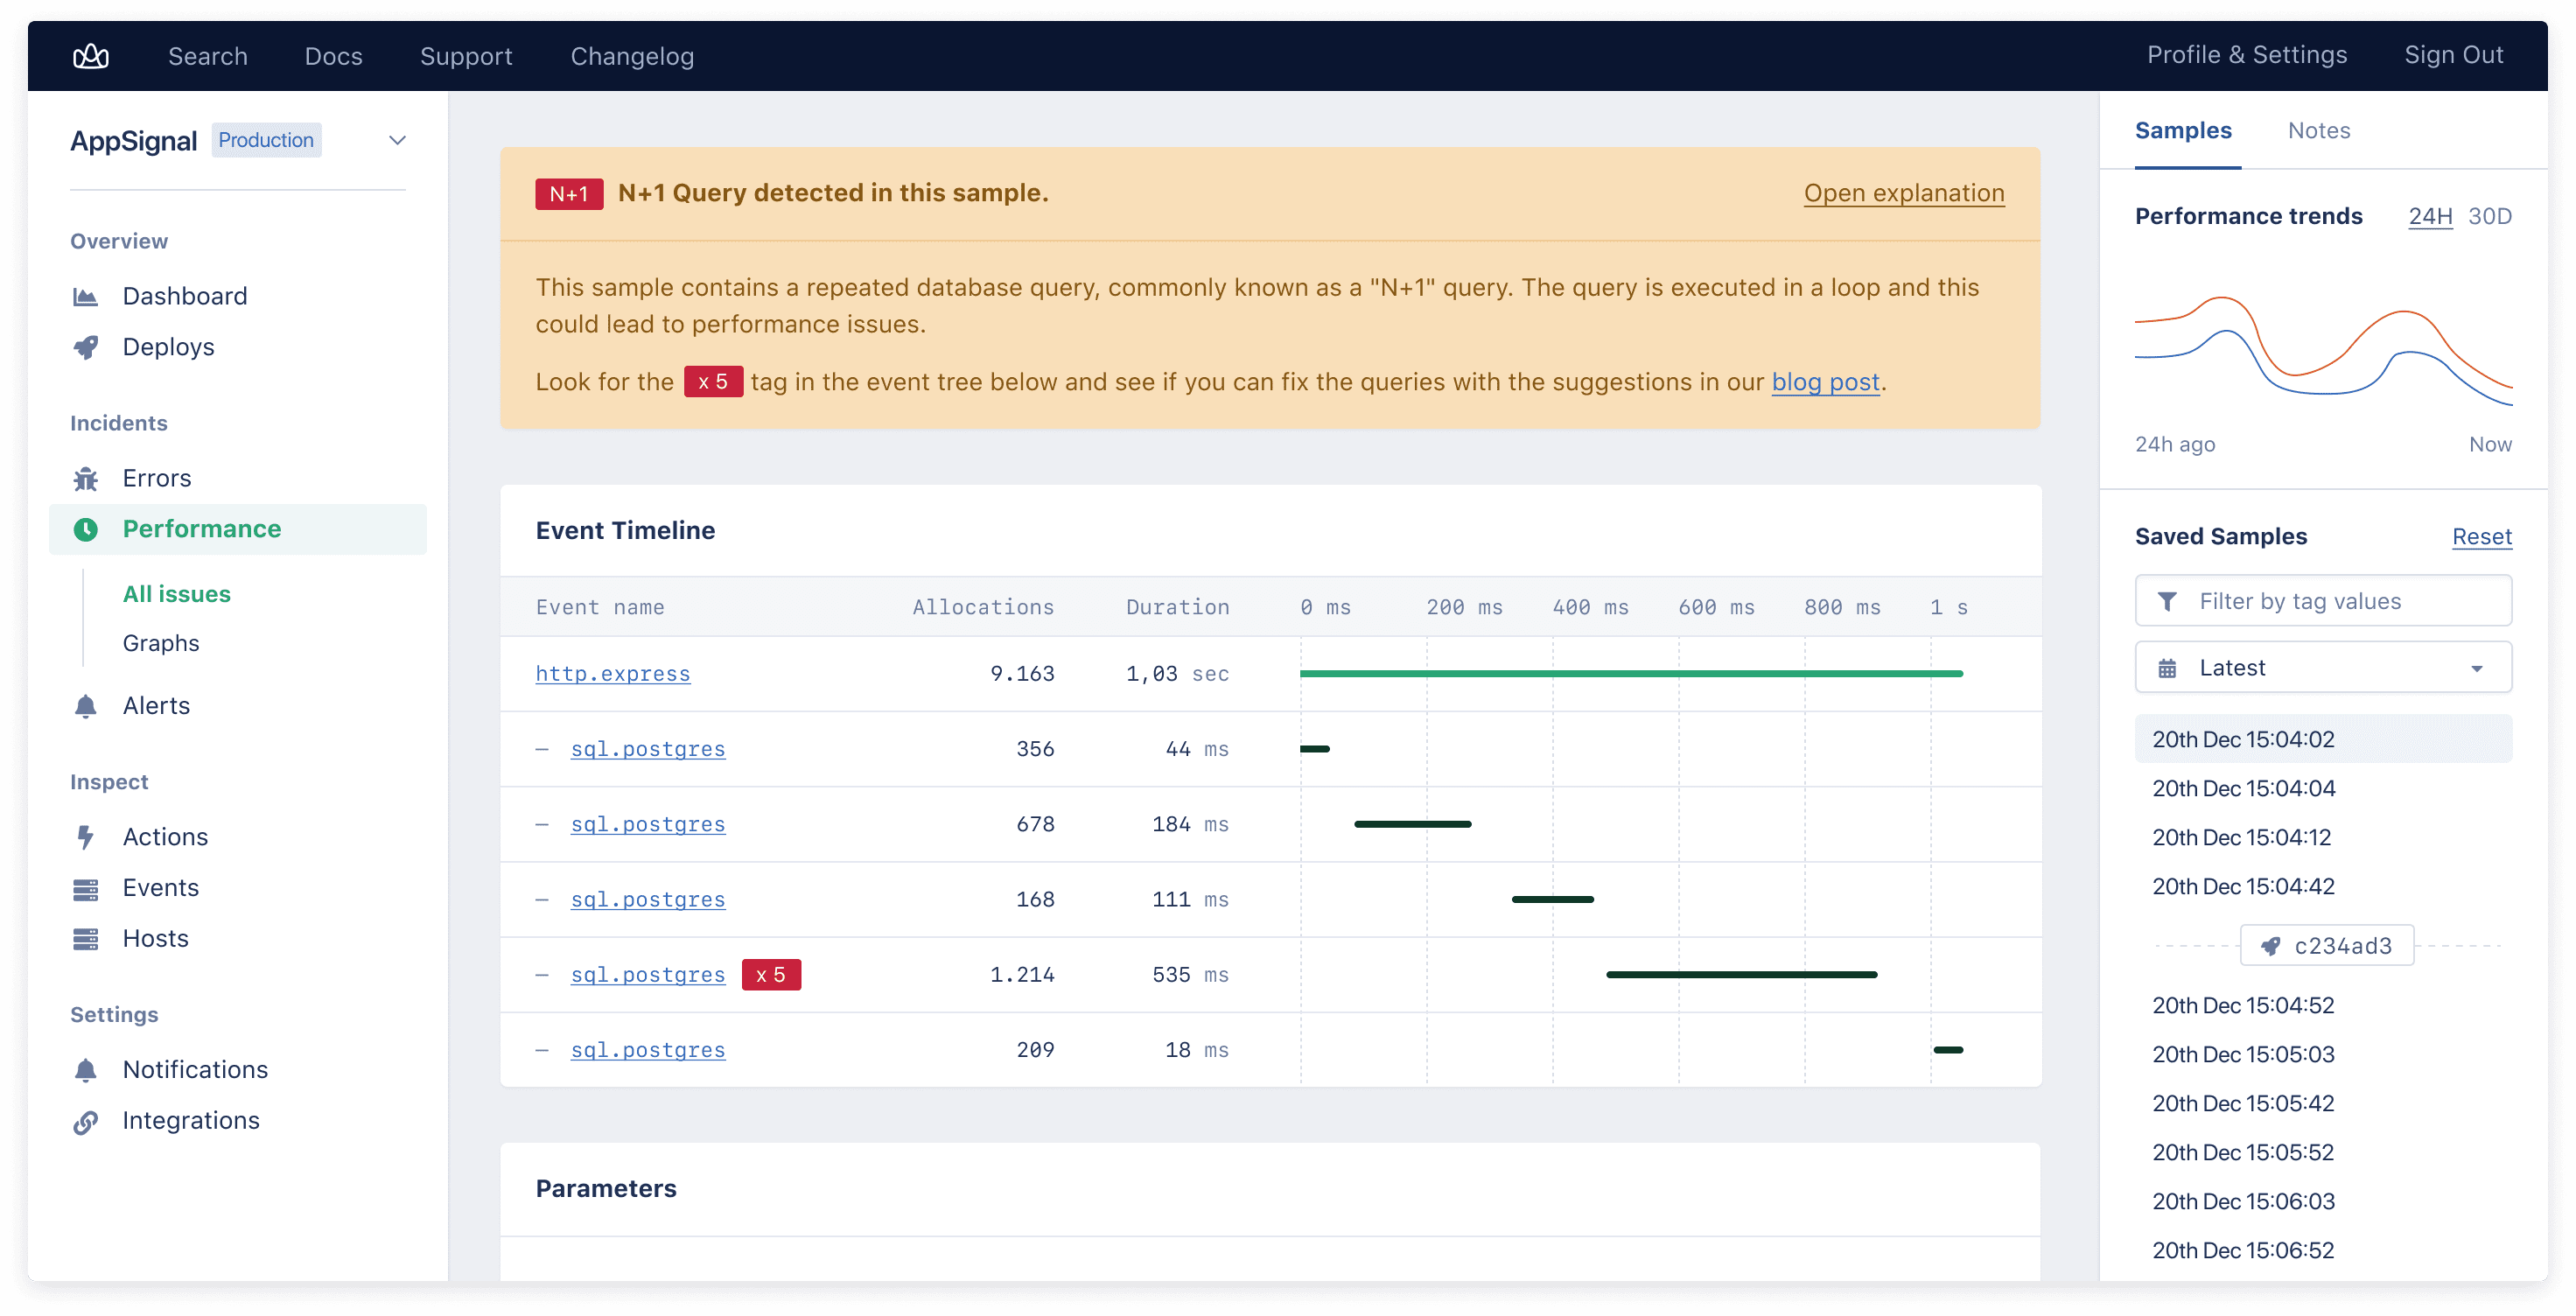
If you want to solve these N+1 issues before they lead to any issues, you can see them all flagged on the Performance issue list page.
Installing Takes Minutes and Brings You Stroopwafels for Days Insights Forever
If we made you curious, you can get AppSignal installed and reporting in 5 minutes. Meanwhile we’ll go back to munching stroopwafels working on the Next (hint, hint) integration 😉
PS. Drop us a note if you are trying AppSignal and want to have some stroopwafels and swag to go with that.