

Garbage collection (GC) is a very important process for all programming languages, whether it's done manually (in low-level languages like C), or automatically.
The curious thing is that most of us barely stop to think about how JavaScript — which is a programming language, and hence, needs to GC — does the trick.
Like the majority of high-level languages, JavaScript allocates its objects and values to memory and releases them when they’re no longer needed.
But, how? How does it work internally?
Well, this article aims to tackle this particular side of the language. Let’s go, then!
👋 Did you know that AppSignal has a Magic Dashboard for Node.js garbage collection stats? This way, using Application Performance Monitoring (APM) for Node.js makes it easy to find performance issues.
JavaScript Memory Lifecycle
First of all, let’s clarify that this article is targeting how JavaScript tackles GC on web browsers. We’ve already covered GC on Node.js’s V8 in another article. Yep, go for it too!
The memory lifecycle for pretty much every programming language works as follows:
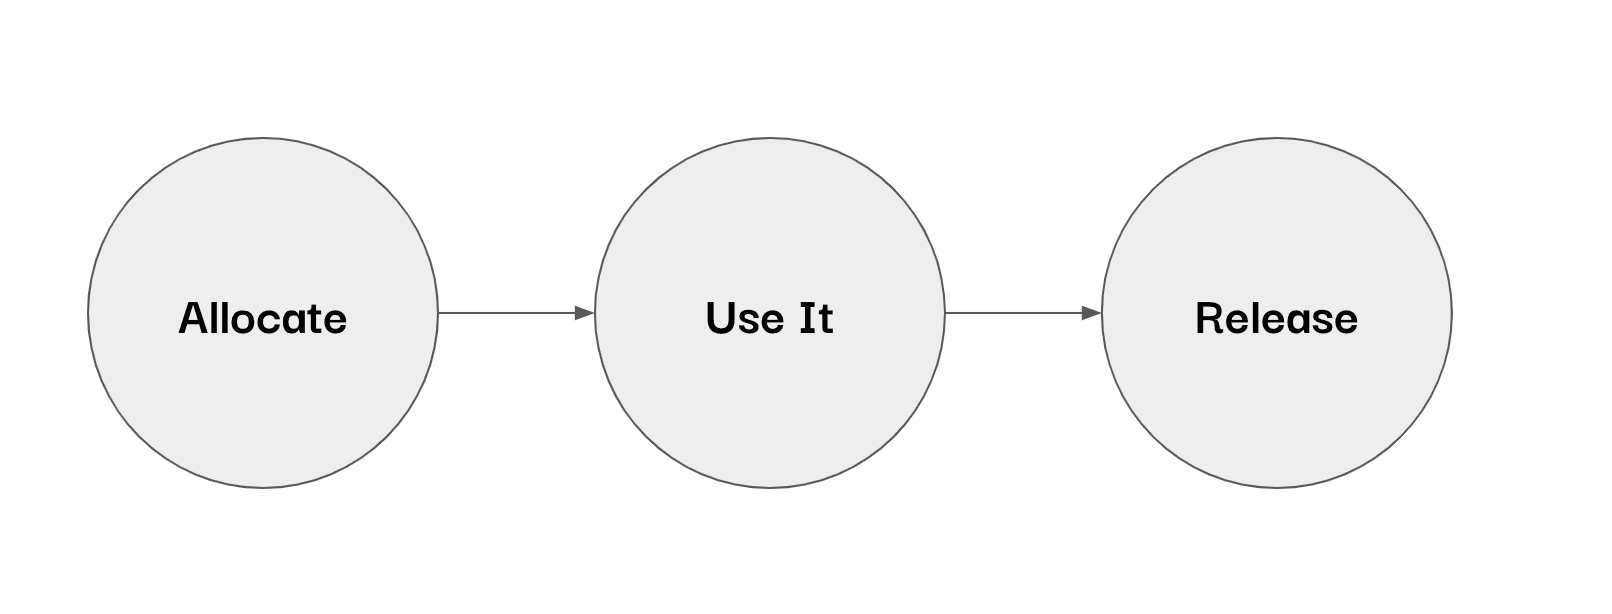
The differences reside in the way they do it (i.e. what algorithms they use) and how each phase must be addressed (manually or automatically).
In JavaScript, the allocation and deallocation phases are automatic. However, it doesn’t mean that developers should only care about the use of the available memory.
Stuff like infinite loops, badly-implemented recursion, and callback hells can drown your memory in no time and lead to memory leaks.
So, yes, the way you code — and, therefore, allocate/release memory slots — is also very important in avoiding such scenarios from happening.
Back to the cycle.
JavaScript works pretty much this way. It allocates space when new variables are created:
1var bar = "bar";And when the memory is no longer being used, respecting the language limitations in terms of variable scopes, the memory is released.
But, how does JavaScript know the memory that's no longer in use? Through its Garbage Collector.
Garbage Collection Strategies
JavaScript uses two famous strategies to perform GC: the Reference-counting technique and the Mark-and-sweep algorithm.
The reference-counting approach is known for its versatility. You can count the number of references pointing to each allocated resource, whether it's a bunch of files, sockets, or memory slots.
It considers that each allocated object in memory will contain a count field (that works as a reference) attached to it. Whenever the object has no references pointing to it anymore, then it is automatically collected.
Consider the following example:
1var bar = {
2  name: "bar",
3};
4bar = "";
Two objects are created here: bar and name. Since bar is receiving a new value on the last line, then name can be garbage collected.
Simple, isn’t it? Now, imagine that your code evolves to the following:
1var bar = {
2  name: "bar",
3};
4var bar = "foo";
5
6function check() {
7  var bar = {};
8  var foo = {};
9  bar.name = foo;
10  foo.name = bar;
11
12  return true;
13}
14check();
JavaScript is a reference-based language when it comes to its objects, which means that the object names point to in-memory instantiated values. More than that, children’s objects/variables are automatically referenced by their parents.
In the above example, we have a cycle being created. The bar inside the check function is referencing foo and vice versa.
Usually, when a function finishes its execution, its inner elements are garbage collected. However, in this case, the GC is unable to do it since the objects are still referenced to one another.
And that’s where the second JavaScript GC actor comes into the scene: the mark-and-sweep algorithm.
This algorithm works by searching for objects that are unreachable from JavaScript’s top object — the root’s global object.
Take the following representation of the previous bar object:
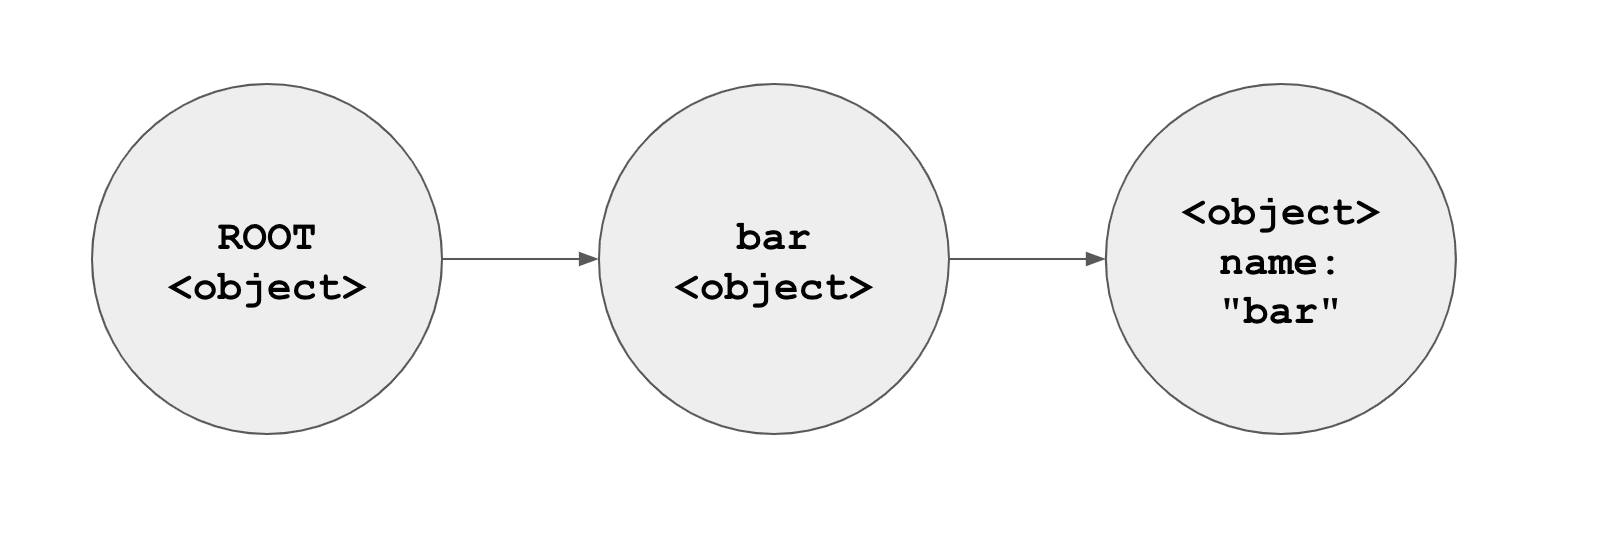
As you can see, JavaScript can easily track down the name object since its hierarchy is well defined.
What happens, then, when the following code snippet runs?
1var bar = "foo";Here you go:
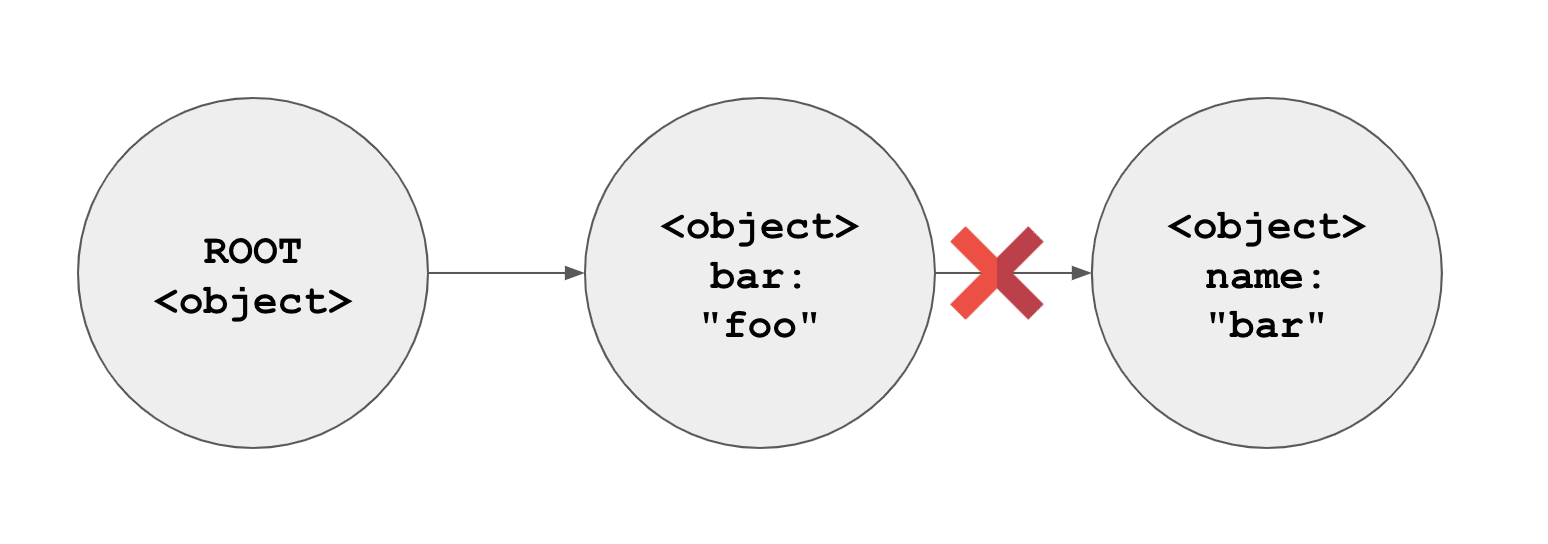
See? We can’t track the object from the root anymore.
The rest of the process is pretty intuitive: the algorithm will go a couple of times, from the root to the bottom objects (and their respective hierarchies) marking — to be ignored — all the objects that are reachable and sweeping from memory at the end of the process, the ones that are not. Like the name object.
It actually makes a lot of sense, doesn’t it?
This process is repeated over and over through some internal conditions that only JavaScript’s GC knows, which is common to most of the GCs out there.
Node.js Garbage Collection
Before we can jump right into the details of how Node.js performs garbage collection, we need to understand two special actors on the set: the heap and stack.
The heap refers to the portion of memory dedicated to the storage of reference types. Reference types are everything that includes objects, strings, closures, etc.
So, whenever you see an object created in JavaScript, this object will be placed on the heap:
1const myCat = new Cat("Joshua");Meanwhile, the stack is the place where references to those objects created on the heap are contained. Function arguments, for example, are good examples of references existing on the stack:
1function Cat(name) {
2  this.name = name;
3}
With all that said, how does V8, which is the JavaScript engine behind Node.js, perform GC?
The heap is divided into two main parts called New Space and Old Space.
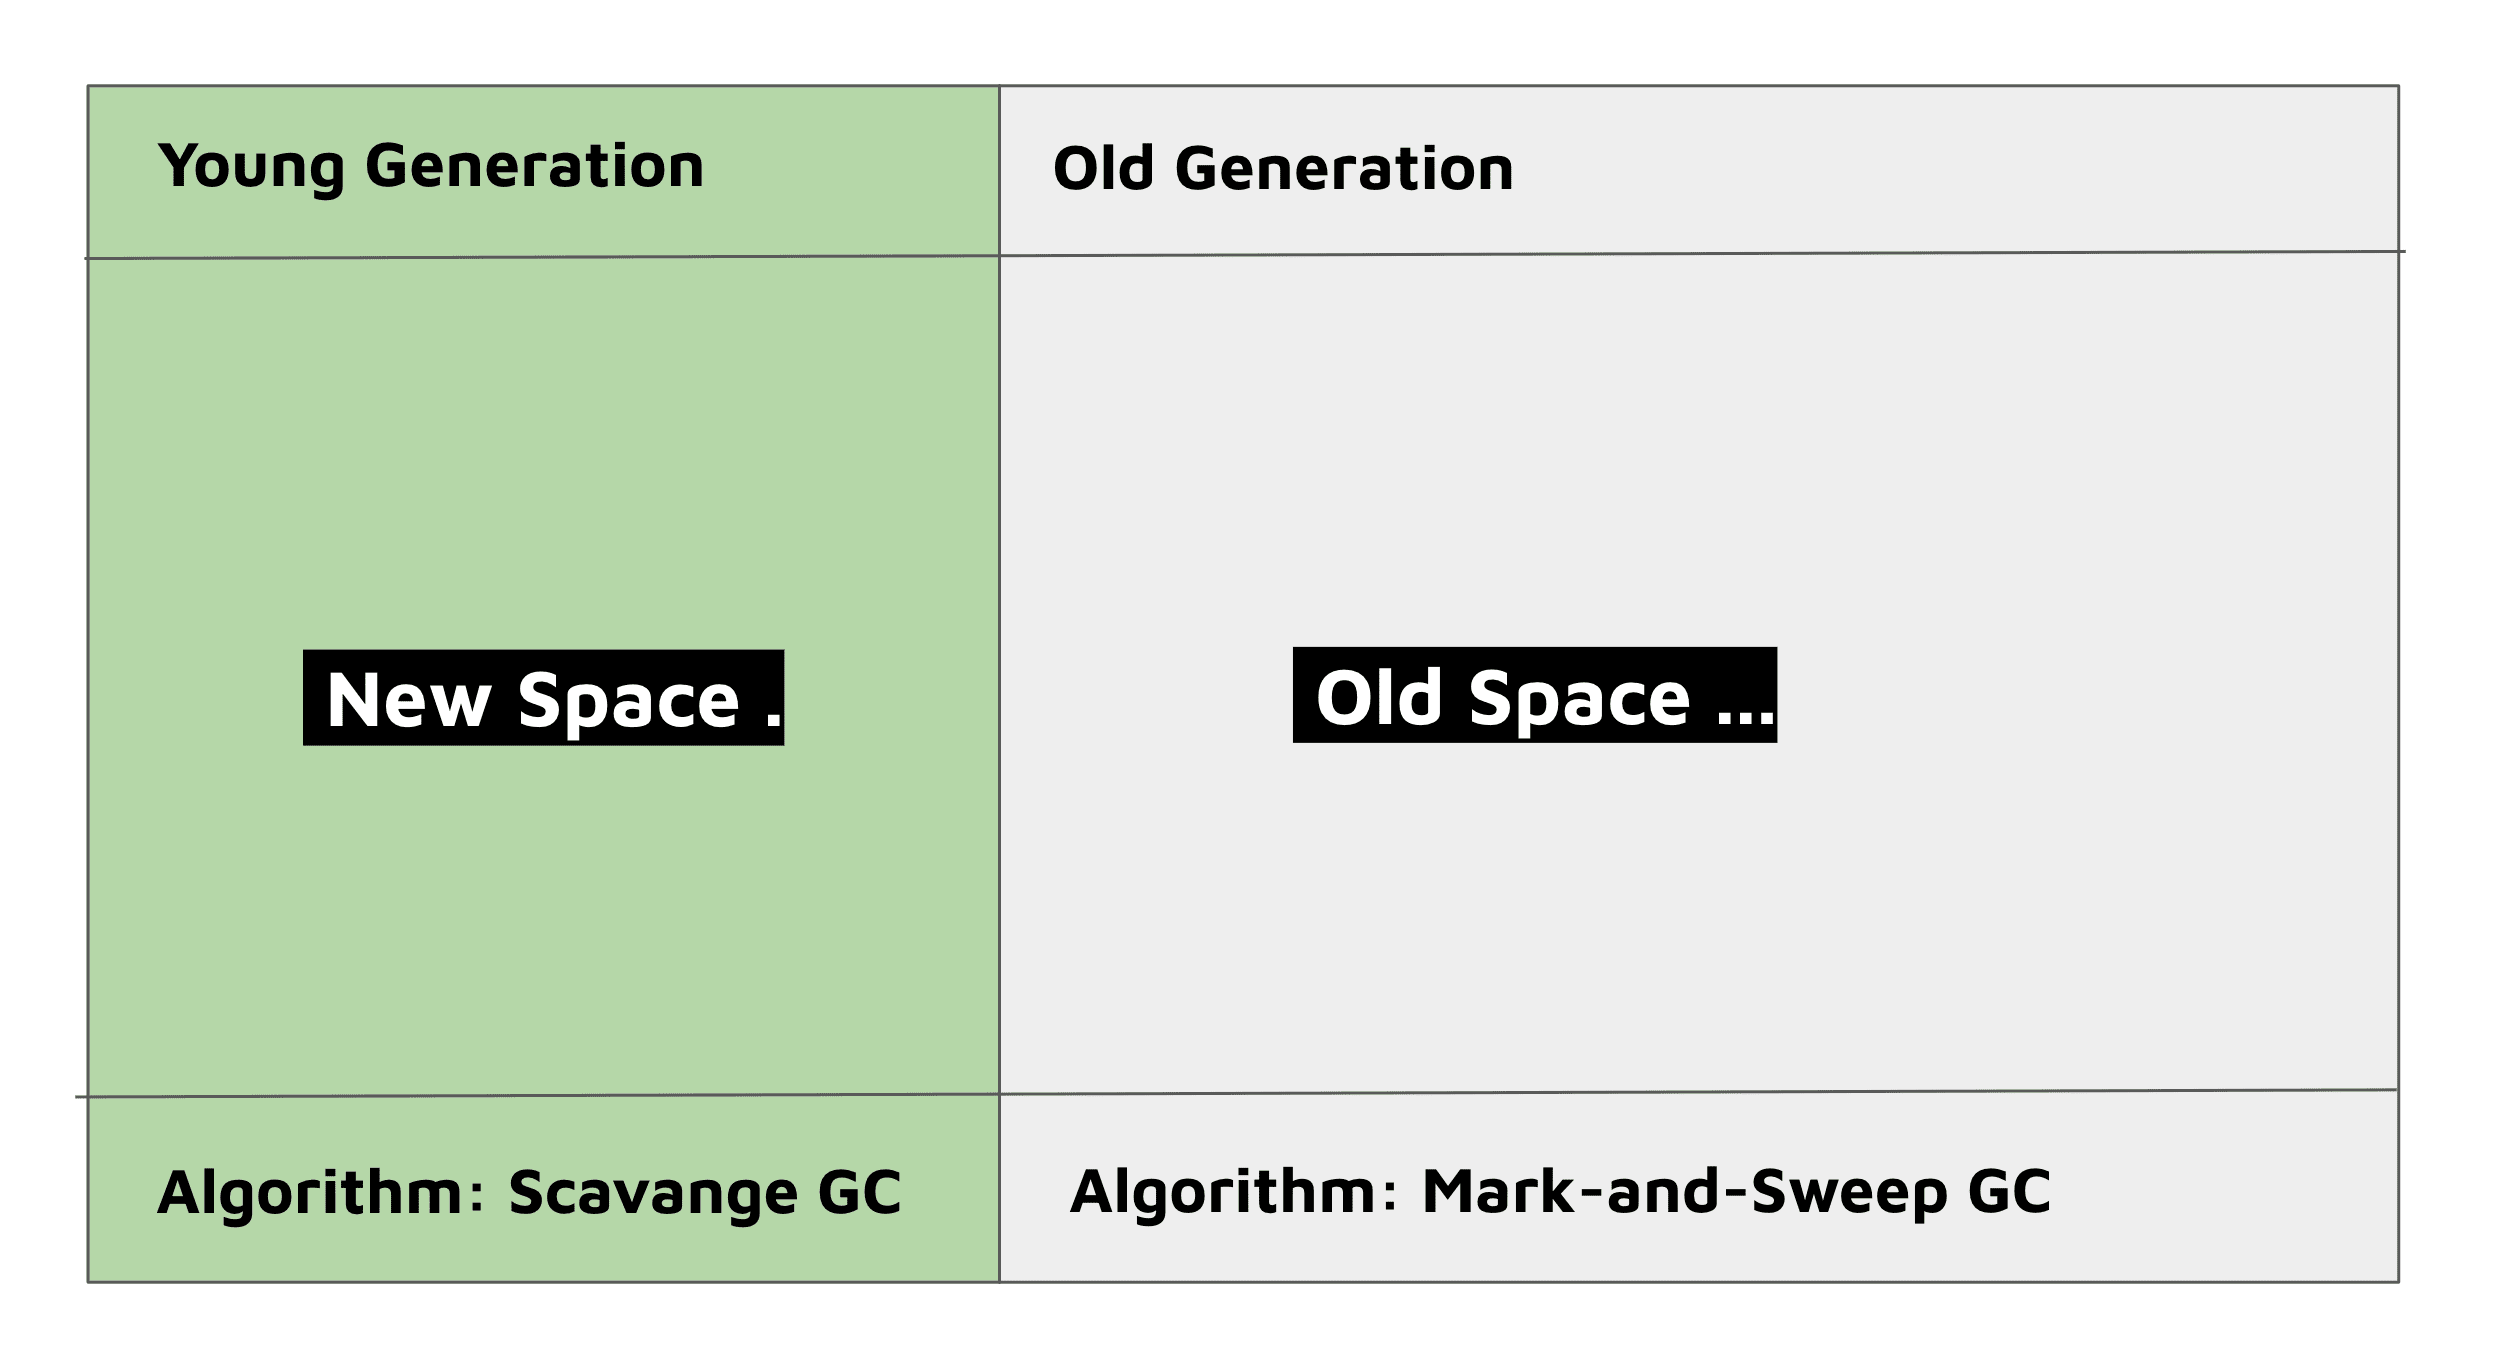
The New Space is the region of memory that allocates new objects and variables and, therefore, is way faster to GC since everything is fresh. As the name suggests, objects living here belong to the Young Generation.
The Old Space is the place that the objects that weren't collected in the New Space head to after some time. They're called the Old Generation. It also stores other types of objects here like too large objects and V8 compiled code, but we won't focus on them.
Node.js will do the best it can to avoid GC into the Old Space since it costs more to do so. This is why only up to 20% of the objects migrate from the Young to the Old Generation. That is also the reason why we have two different algorithms to deal with each generation:
- Scavenge: this garbage collector takes care of the Young Generation by cleaning up small portions of memory every time it runs. It is super fast, which fits very well with the Young Generation nature.
- Mark-and-Sweep: we know this guy already. Since it is slower, it's the perfect choice for the Old Generation.
Identifying Memory Leaks in Node.js
A great way to see how JavaScript deals with memory in Node.js is through a classic memory leak example. Remember that a memory leak happens when all GC strategies have failed to find the object because it lost its connection to the root object. Other than that, we can also have a leak when an object is always referenced by other objects and, at the same time, continues to grow in size.
For example, imagine that you have a simple Node.js server that you manually created and you want to store some important data from all the requests, as seen below:
1const http = require("http");
2
3const ml_Var = [];
4const server = http.createServer((req, res) => {
5  let chunk = JSON.stringify({ url: req.url, now: new Date() });
6  ml_Var.push(chunk);
7
8  res.writeHead(200);
9  res.end(JSON.stringify(ml_Var));
10});
11
12const PORT = process.env.PORT || 3000;
13server.listen(PORT);
So, we're creating a manual audit log from our requests. The variable ml_Var is the dangerous spot in our code since it is a global variable and, therefore, is going to live in memory until the server shuts down (which can take a long time).
Objects like that can become a huge problem in your apps, especially because other developers can add items to the array in other places that you won't be able to monitor.
To simulate the scenario, we're going to make use of the Google Chrome DevTools. Wait, but this is a Node.js application... right? Yes, because both Chrome and Node.js uses the same JavaScript Engine (V8), the DevTools can understand how to debug and memory inspect both universes. Isn't it great?
All that you need to do is to start your Node.js server with an --inspect flag:
1node --inspect index.jsAfter that, you may see the following output:
1Debugger listening on ws://127.0.0.1:9229/16ee16bb-f142-4836-b9cf-859799ce8ced
2For help, see: https://nodejs.org/en/docs/inspector
Now, head to your Chrome (or Chromium) browser and enter the chrome://inspect address. The following screen may appear:
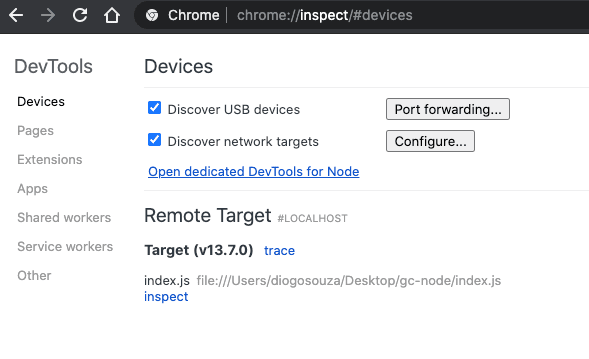
Google Chrome DevTools Remote Target.
Within the "Remote Target" section, there's an "inspect" link. When you click on it, the DevTools extension may open up with a direct session for your Node.js application. You'll be able to see the logs, sources, perform CPU profiling and memory analysis as well.
If you head to the Memory tab, you'll see a "Take snapshot" button located at the bottom of the page. Click on it and the DevTools will generate a heap snapshot profile (a memory dump) of our current running application. Since the goal is to compare the memory before and after the leak happens, that's our first step in the process.
However, before we can take the other memory dumps, we need an auxiliary tool to help with benchmarking. In other words, we need to stress the application with many requests to validate the memory leak. And siege.js is the perfect tool for that.
Siege is a Node.js benchmarking tool that simplifies the task of running hundreds or thousands of requests against an endpoint.
First, we'll need to run the npm install siege --save command to get it installed and then, create another JavaScript file called benchmark.js and add the following content:
1const siege = require("siege");
2
3siege().on(3000).for(2000).times.get("/").attack();
Here, we're asking siege.js to run a total of 2000 requests on the root endpoint located under port 3000. As simple as that!
Great! Now, we can move on to the other heap snapshots. Run the benchmark file:
1node benchmark.jsWait until it finishes. It'll produce the following output:
1GET:/
2    done:2000
3    200 OK: 2000
4    rps: 1709
5    response: 5ms(min)  23ms(max)   9ms(avg)
Get back to DevTools and hit the "Take snapshot" button again. Just for safety, let's repeat the process once again until we have 3 snapshots. This will help to fine-tune the overall memory analysis.
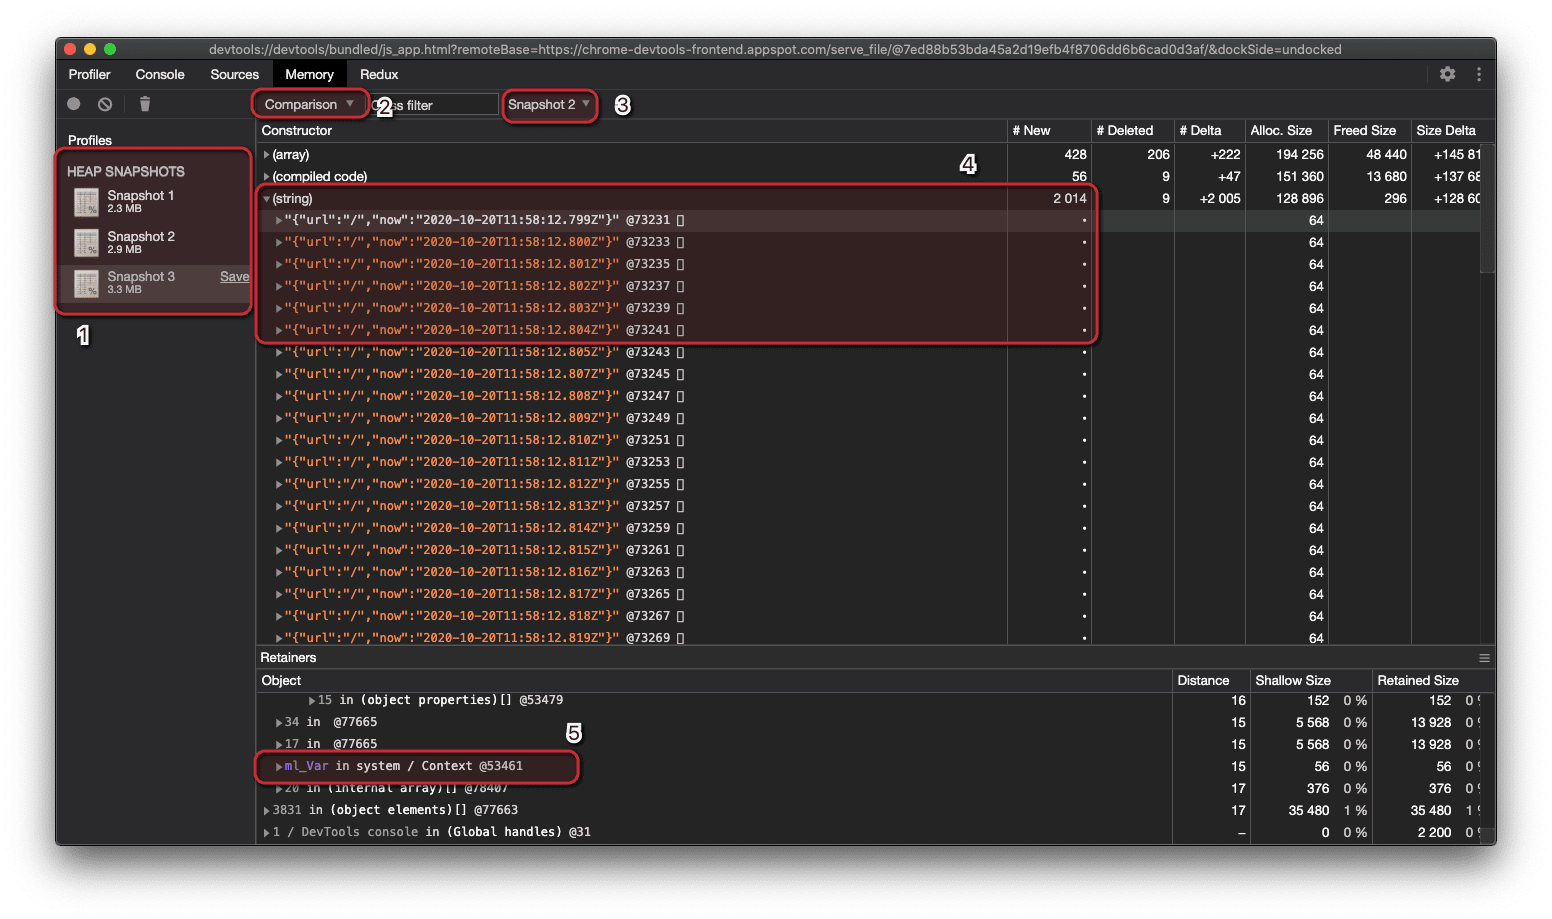
There are a couple of points to clarify here:
- The list of head snapshots. Select the third one to compare against the second.
- We need to select "Comparison" to enable the DevTools comparison features.
- Select the snapshot you'd like to compare with.
- The list of constructors created within the memory. The "# New" column will show the number of new objects created from the previous snapshot to the current one. Pay attention to the content of each string, they correspond to the JSON request logs we've created.
- The "Object" section brings details over the stack that has created each object. For the JSON strings,
ml_Varis the context in which they were created.
It's interesting to see that 2014 string objects were created from one snapshot to another. The 2k refers to the request logs we introduced, the other 14 are strings created and managed by Node.js itself.
In our example, only 3 executions led to 4k new objects in memory. Imagine such a scenario in a real application running in production. In no time, the memory would leak until there was nothing left.
Now that you've identified the leak, the solution is quite simple. Just make sure to store those logs into a file, to an external service (like Splunk) or even to a database.
Wrapping Up
Do you now understand the importance of proper attention when coding your JavaScript applications in terms of object allocation and deallocation?
As further reading, I’d recommend the famous IBM study of memory leak patterns in JavaScript, which explores the consequences of circular references in the language.
If you'd like to read more about memory leaks in Node.js, I strongly recommend Deepu Sasidharan's article in which he talks about the best practices for performance in Node.js.
Mozilla's official docs also bring a handful of great articles about performance, including profiling, performance measurements, and automation. See you around!
P.S. If you liked this post, subscribe to our new JavaScript Sorcery list for a monthly deep dive into more magical JavaScript tips and tricks.
P.P.S. If you'd love an all-in-one APM for Node.js or you're already familiar with AppSignal, go and check out AppSignal APM for Node.js.